Universal Dashboards
This is a new module for all the customers that have Marketing Plan by selection and want to have an overview of their business.
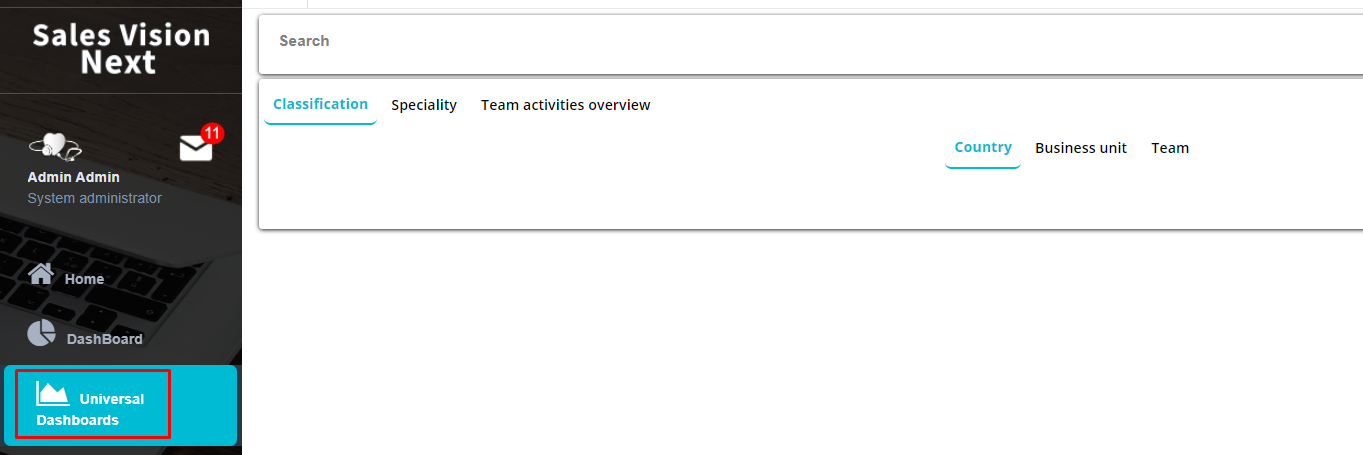
To see actually the dashboard you need to click on the Search section where a new window appears with the selection of the Marketing plan which will automatically select the Representative. After the selection click on Refresh to apply changes on the filter.
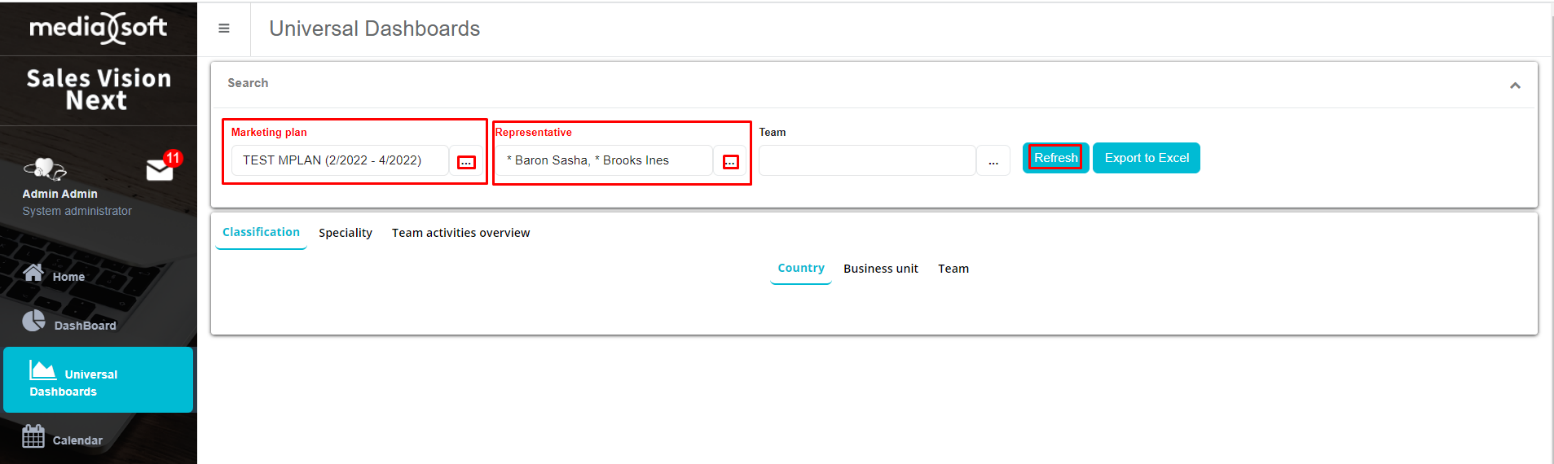
By default, the Classification tab is selected which is displaying data by three different types of overview.
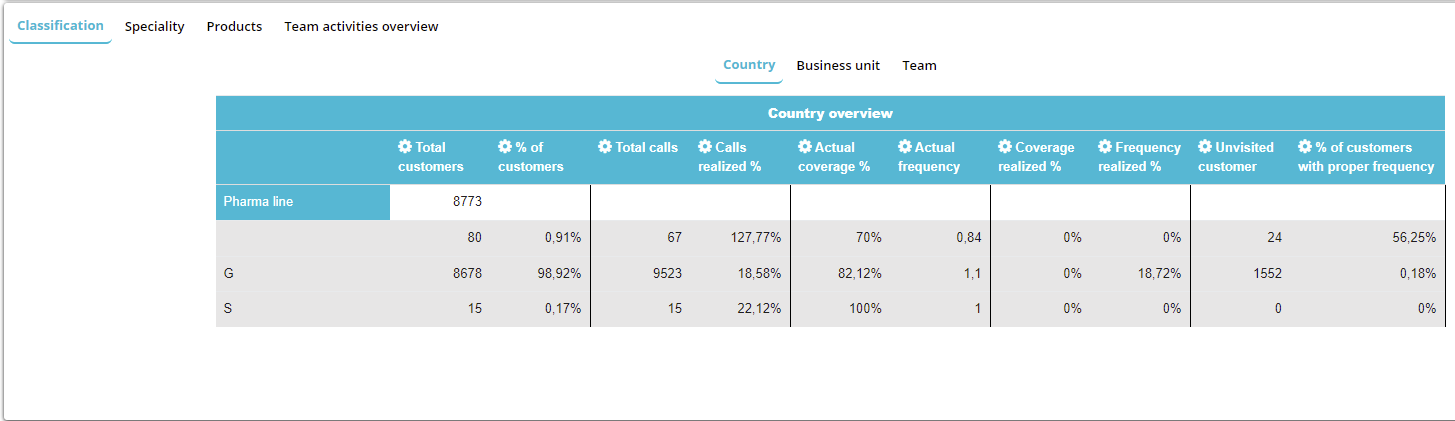
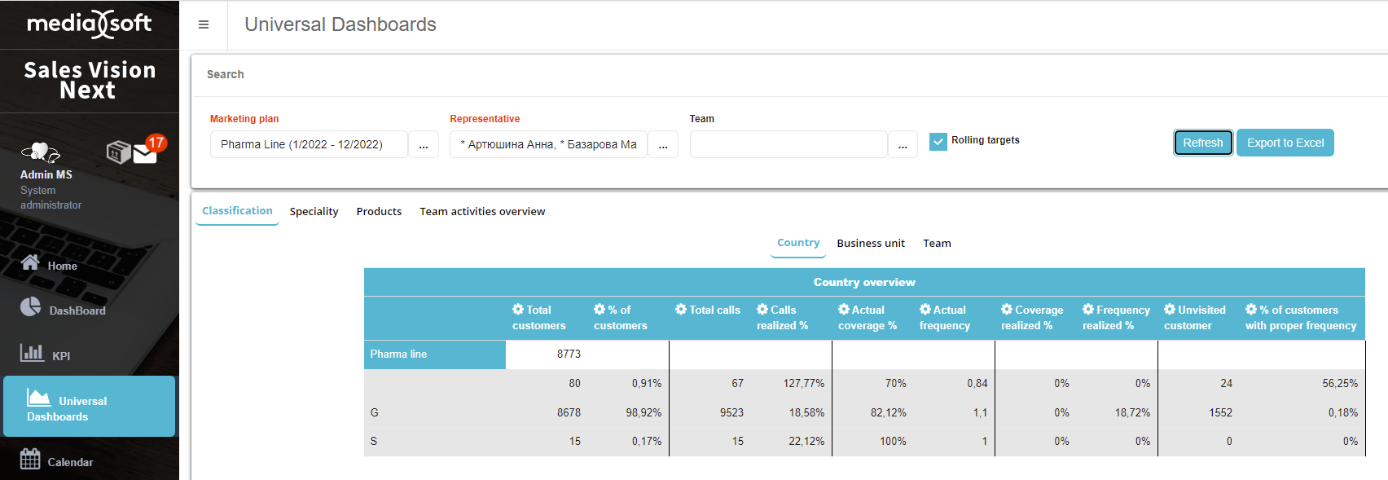
Tab Classification - Country overview
It shows how many customers are contacted and how many are real customers, how many total calls are made and how much calls are business related etc. with named specialities. Let’s take a look on how the numbers are calculated: Total number of customers are 8773 which 8678 are classified as G, 15 are classified as S and 80 customers are without classification % of customers - Classified customers / Total number of customers = 80 / 8773 = 0,0091 * 100 = 0,91 % = 8678 / 8773 = 0,98917 * 100 = 98,92 % = 15 / 8773 = 0,0017 * 100 = 0,17 % For other calculation I’m going to use only one representative in the Marketing plan that contains persons and Institutions for the classification G.
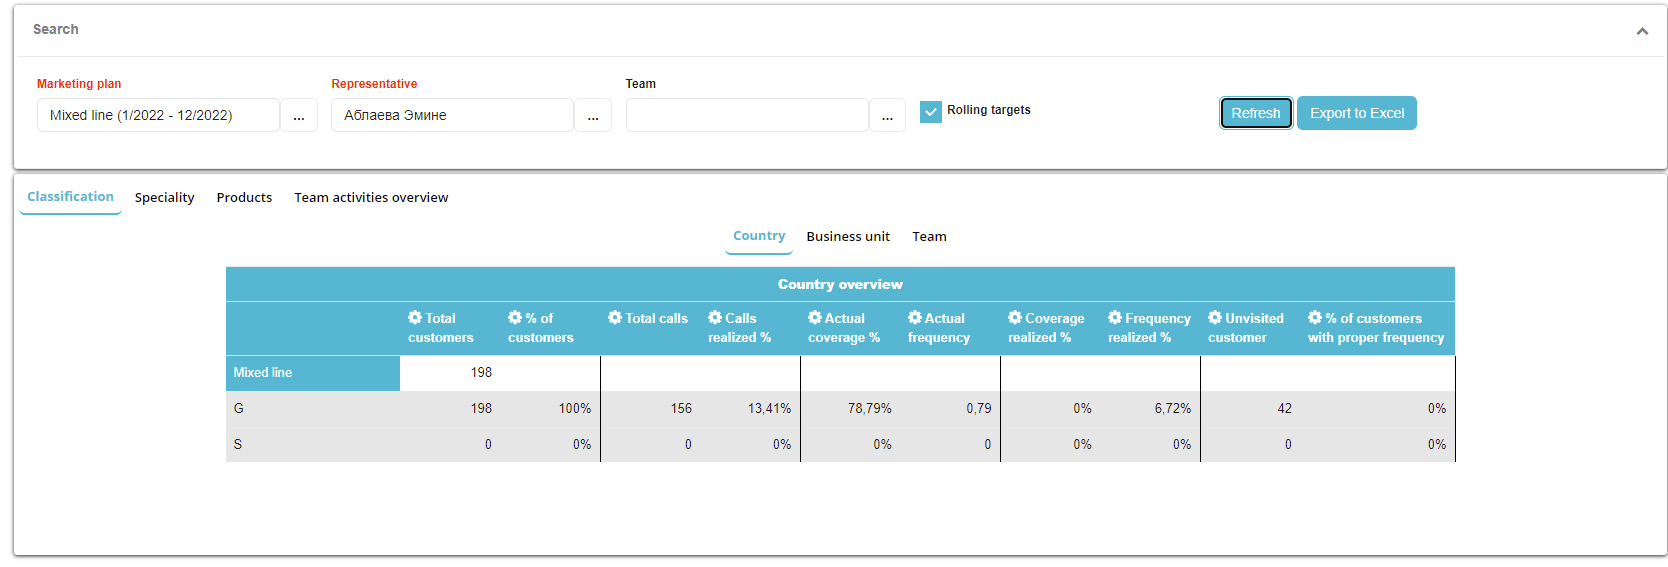
Next we have the following:
Total calls for the G classification is calculated as sum of defined persons and institution attached in the Marketing plan and equals: 72 + 84 = 156
Calls realized %
Actual coverage % - Total calls / Total customers = 156 / 198 = 0,7879 * 100 = 78,79 %
Actual frequency – Total calls / Total customers = 156 / 198 = 0,79
Coverage realized % - Calls realized % / Planned coverage defined in the marketing plan = 13,41 / 0 = 0 %
Frequency realized % - Actual frequency / Number of visits defined in the marketing plan
= 0,79 / 12 = 0,066 * 100 = 6,6 %
Unvisited customer – Total customers / Total calls = 198 – 156 = 42
% of customers with proper frequency – Number of calls where number of visit on Persons is identical to number of visits set in marketing plan / Total calls = 0 / 71 = 0 %
Tab Classification - Business unit, Team overview
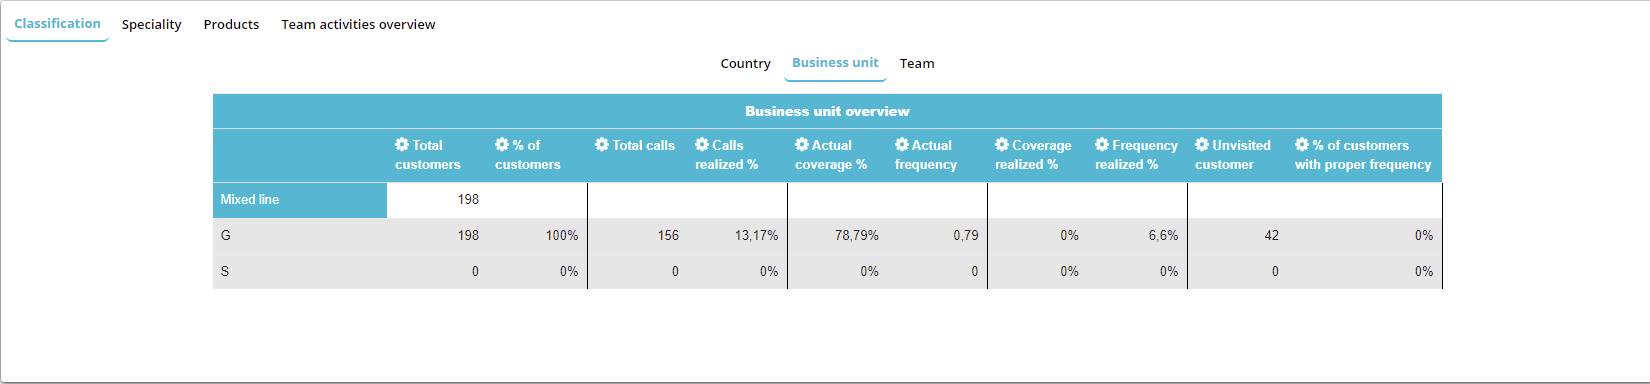
Same as Country Overview but regarding the Business unit.
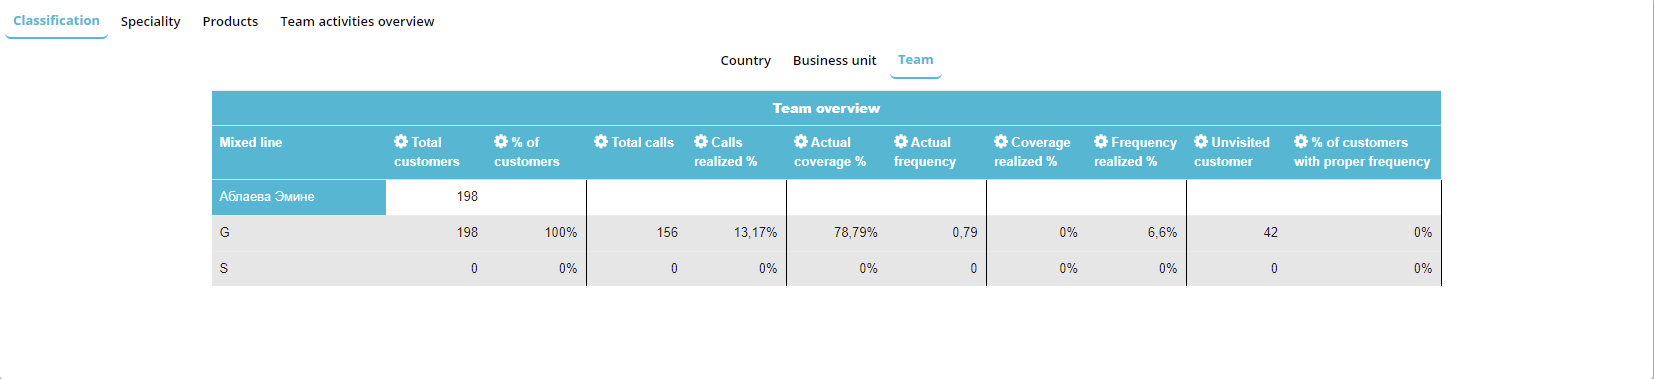
Gives the same informations but with named workers and their teams.
The next tab is the Speciality tab which is displaying data by person specialities by three different types of overview.
Tab Speciality – Country, Business unit, Team overview
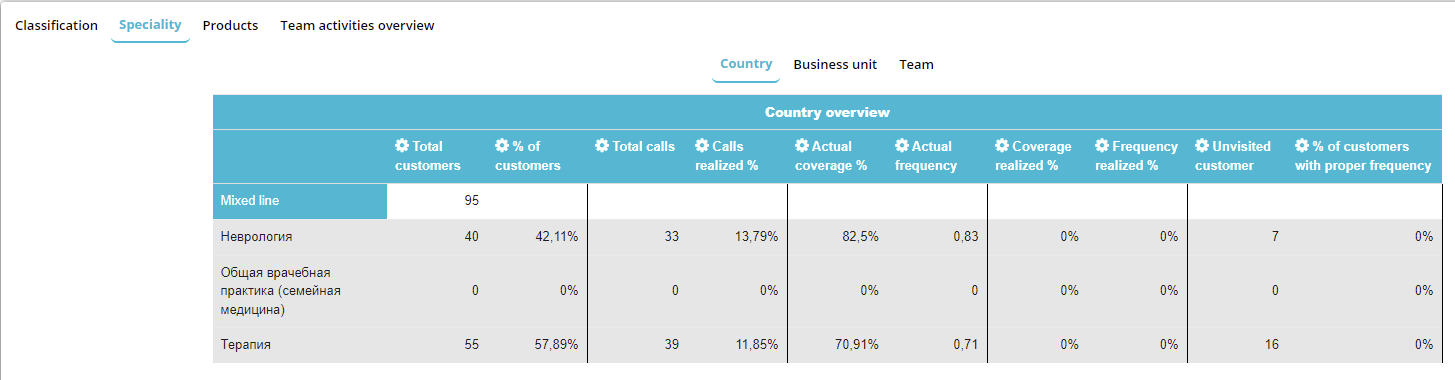
The calculation are pretty much the same, but still some different values are taken from Marketing Plan: % of customers - Classified customers / Total number of customers (Неврология) = 40 / 95 = 0,4211 * 100 = 42,11 %
Calls realized %
Actual coverage % - Total calls / Total customers = 33 / 40= 0,825 * 100 = 82,5 %
Actual frequency – Total calls / Total customers = 33 / 40 = 0,825
Coverage realized % - Calls realized % / Planned coverage defined in the marketing plan = 13,79 / 0 = 0 %
Frequency realized % - Actual frequency / Number of visits defined in the marketing plan = 82,5 / 0 = 0 %
Unvisited customer – Total customers / Total calls = 40 – 33 = 7
% of customers with proper frequency – Number of calls where number of visit on Persons is identical to number of visits set in marketing plan / Total calls = 0 / 71 = 0 %
Tab Products - Country, Business unit, Team overview
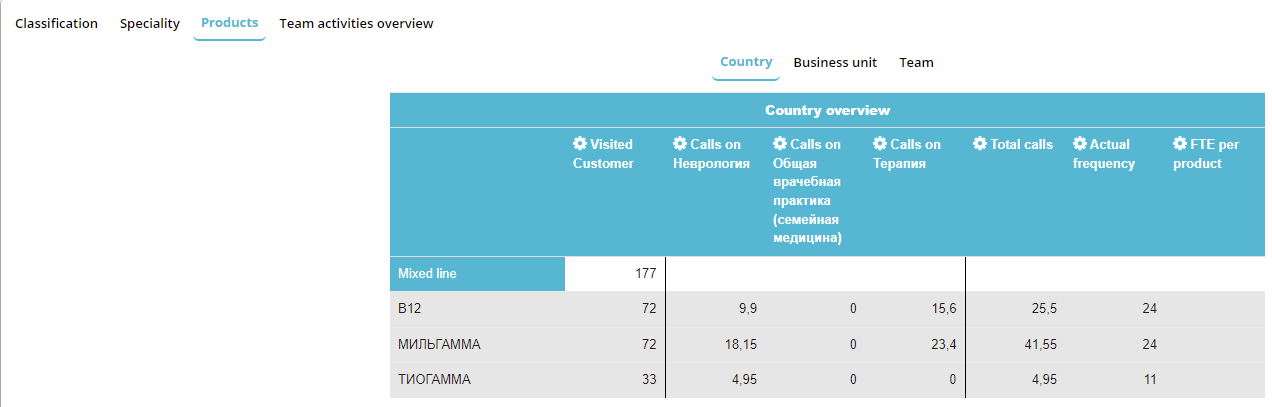
For better calculation I changed the capacity of the Marketing plan to 2 so there we get result like this below.
The calculation follows: Calls on Неврология for B12 – Total calls for Неврология * Time spent on Неврология = 33 * 30 % (0,3) = 9,9
Calls on Общая врачебная практика for B12 – Total calls for Общая врачебная практика * Time spent on Общая врачебная практика = 0 * 0 % (0) = 0
Calls on Терапия for B12 – Totals calls for Терапия * Time spent on Терапия = 39 * 40 % (0,4) = 15,6
Total calls for B12 – Sum of all calls for all specialities = 9,9 + 15,6 = 25,5
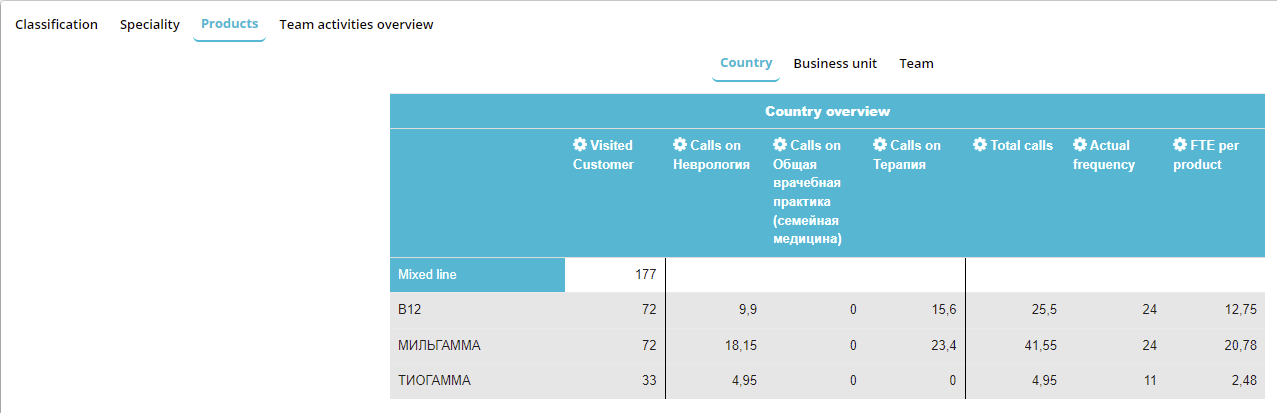
Actual frequency for B12 – Number of total calls / Number of defined products = 72 / 3 = 24
FTE per product for B12 – Total calls / Sum of the capacity in the marketing plan = 25,5 / 2 = 12,75.
Tab Team activites overview
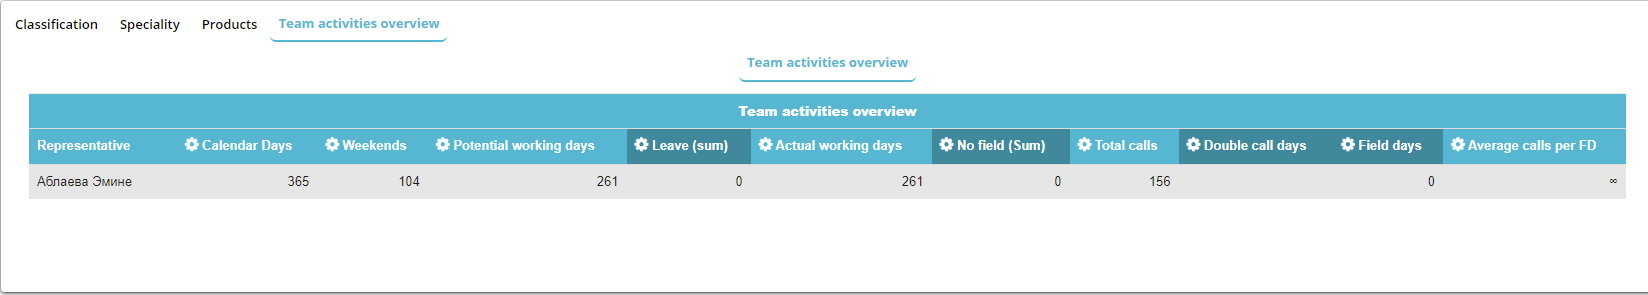
This tab shows an overview for every representative regarding the working days and calls made.
The calculation is following: Calendar Days – days in a whole year = 365 Weekends – weekends without day report = 104 Potential working days – Calendar Days – Weekends = 365 – 104 = 261 Leave (sum) – sum of all LEAVES = 0 Actual working days – Potential working days – Leave (sum) = 261 – 0 = 261