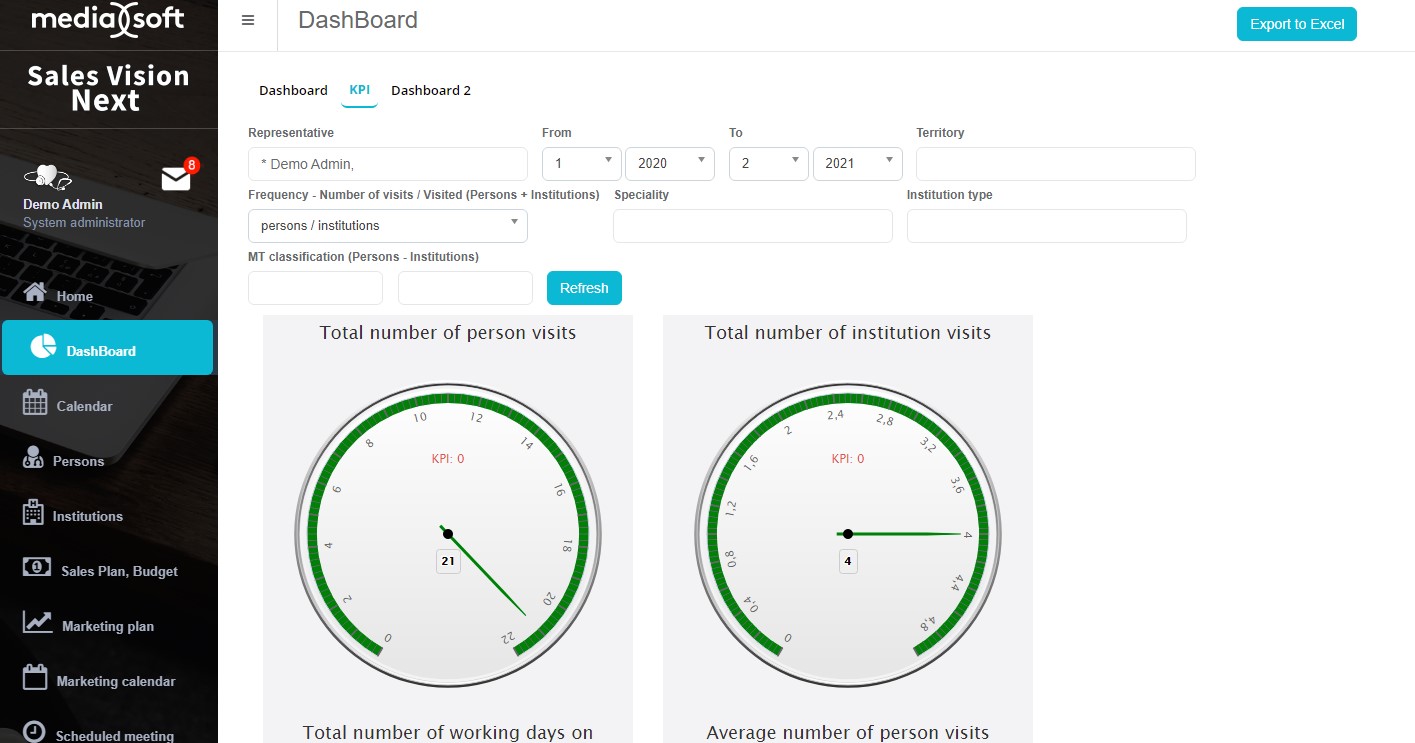
Dashboard
Dashboard is the module where you can see various graphics diagrams about various data such as sales/sales plan comparison, planned visits/potential market shares (from data view or predefined) etc. In the main menu, click on the icon Dashboard in order to access the module. Dashboards are predefined graphical charts, where you can ad hoc see your results according to the KPI. This is how the Dashboard module looks like when you open it and want to preview dashboard as enlarged.
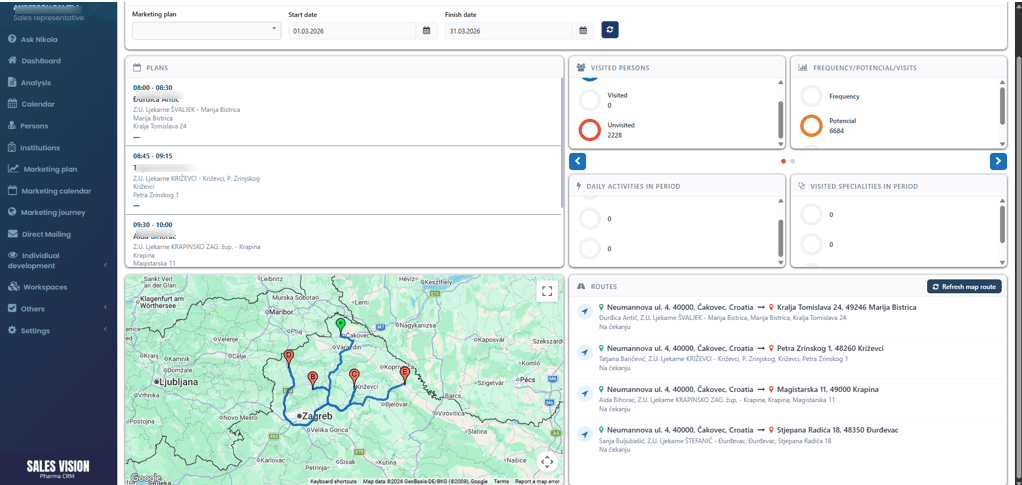
Routing dashoard
The Routing Dashboard is available exclusively to SR users and provides an overview of assigned routes displayed on an interactive map. To improve usability and ensure data accuracy, a manual refresh button has been introduced, allowing users to update the displayed route at any time.
The system is designed to automatically refresh route data when changes occur within the same day (e.g., updates to stops, scheduling adjustments, or reassigned routes). This ensures that users are always presented with the most up-to-date information without requiring manual intervention.