There are some prerequisites to define before we can use the KPI module.
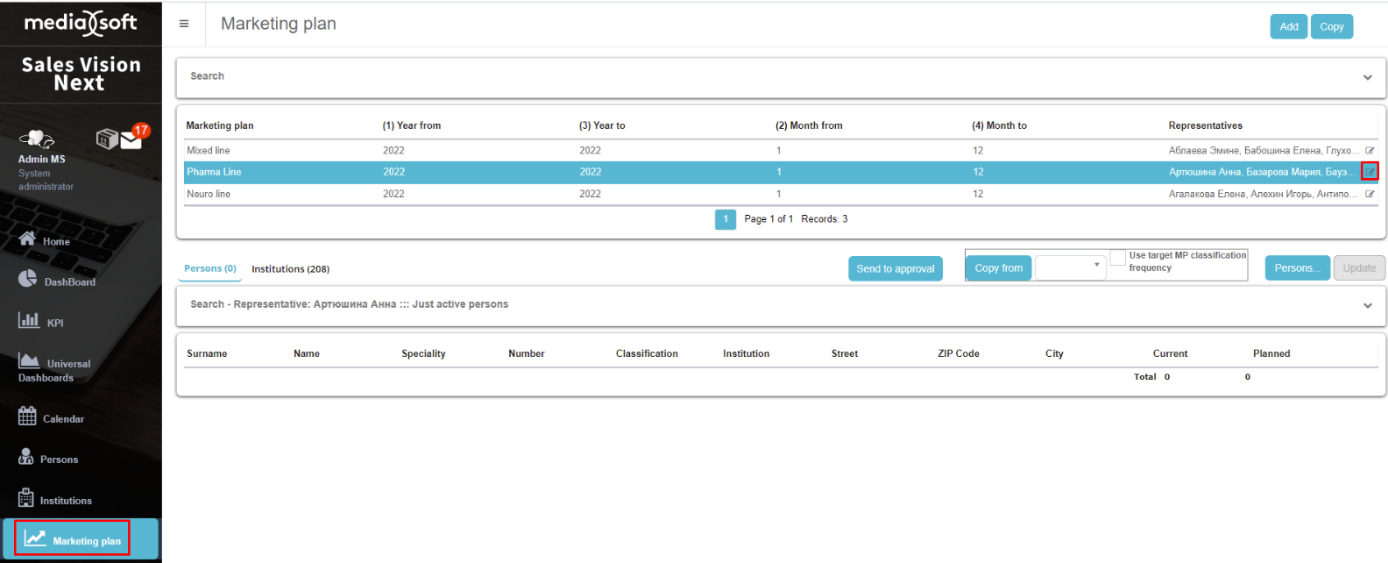
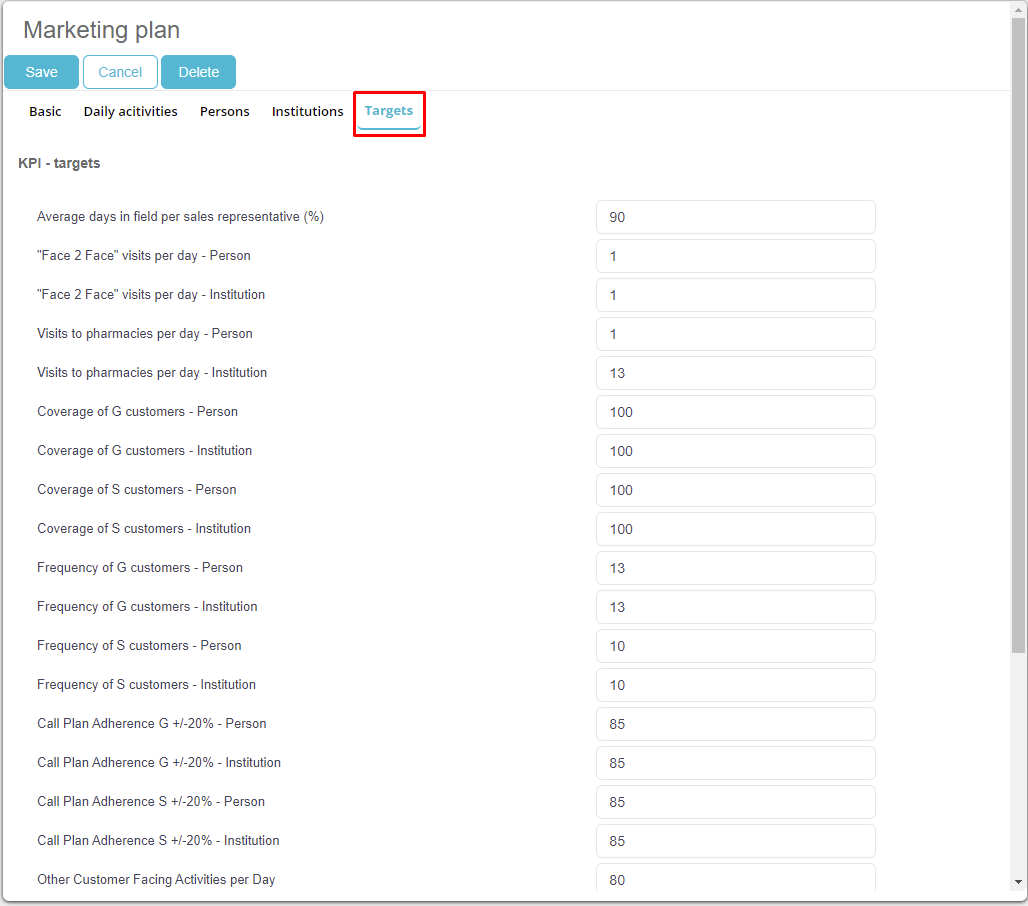
After the selection of the Marketing plan go to Targets and there you can define the values for each KPI. there are also informations under the Persons and Institutions tab regarding the duration of the Marketing plan. When you filled out the values simply click on Save.
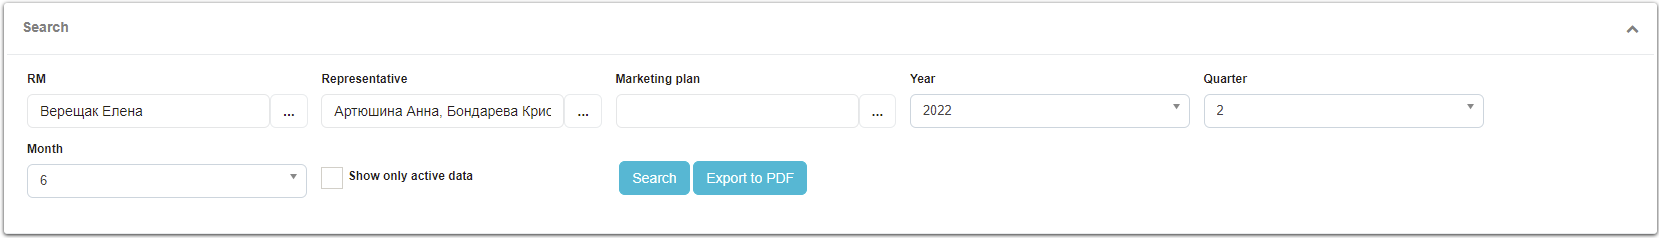
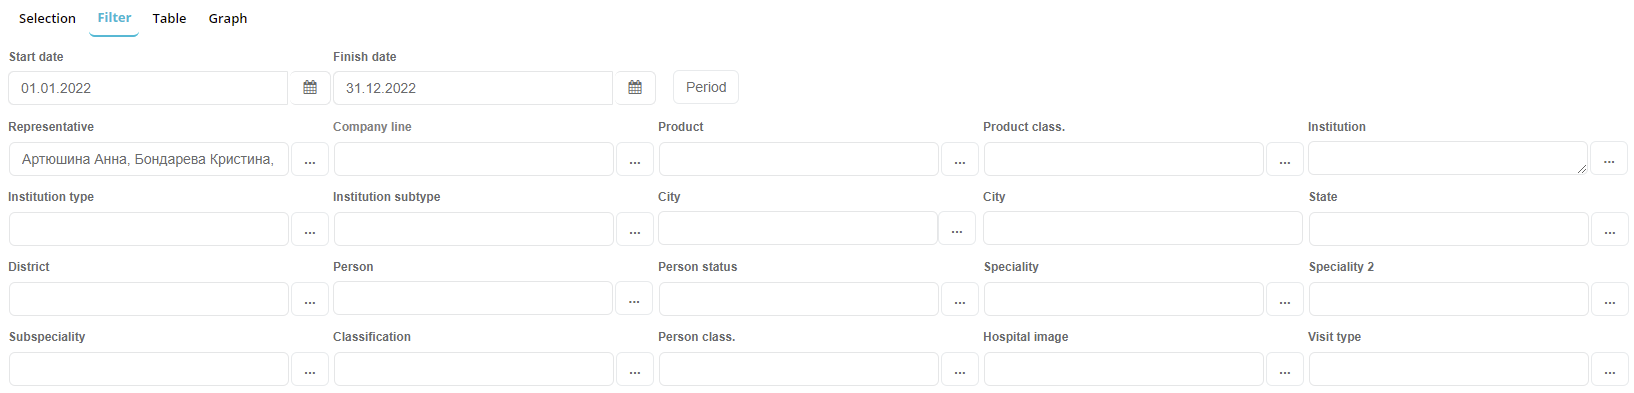
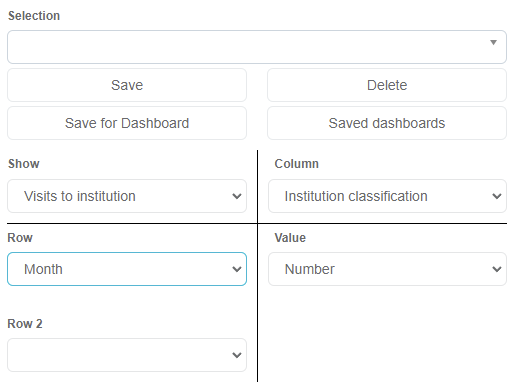
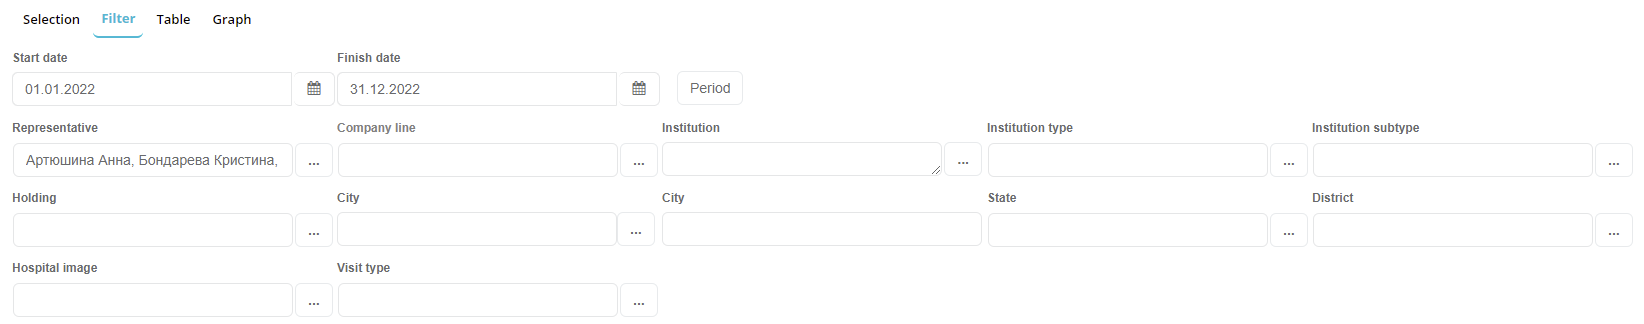
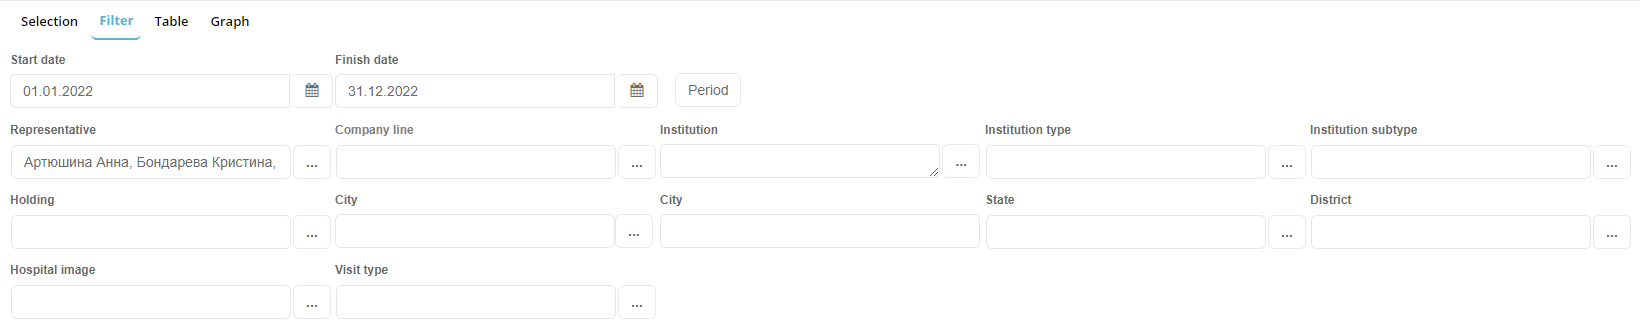
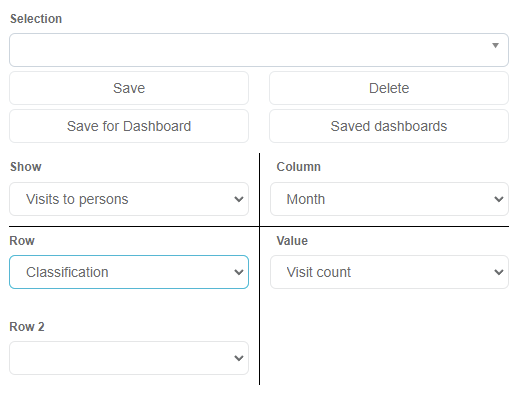
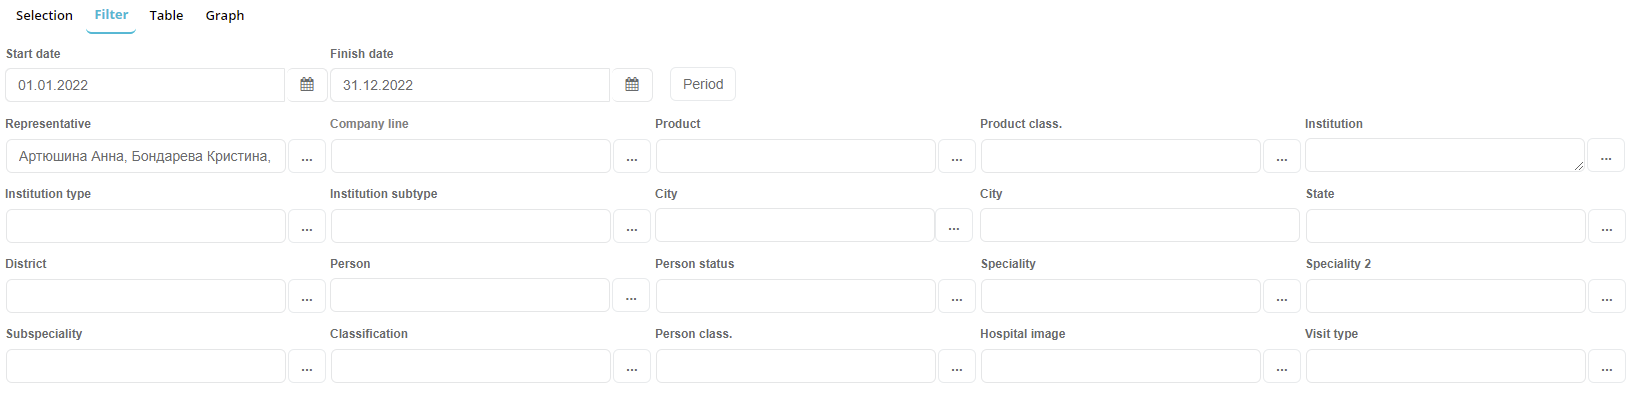
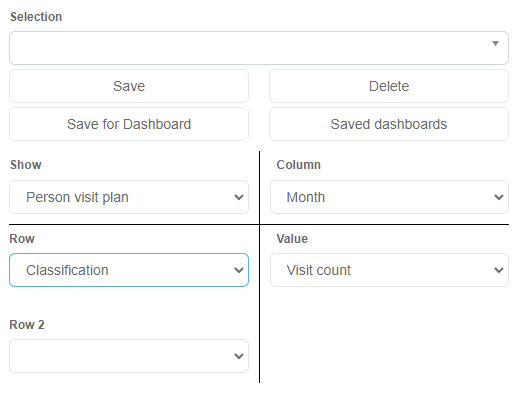
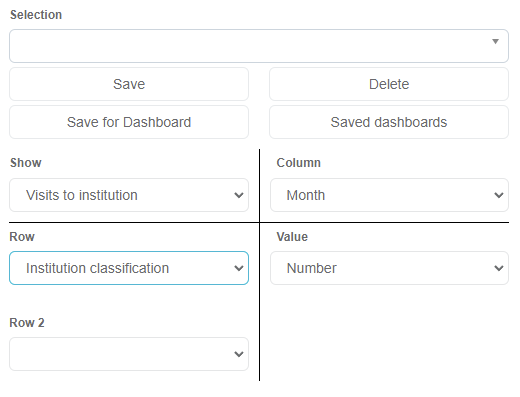
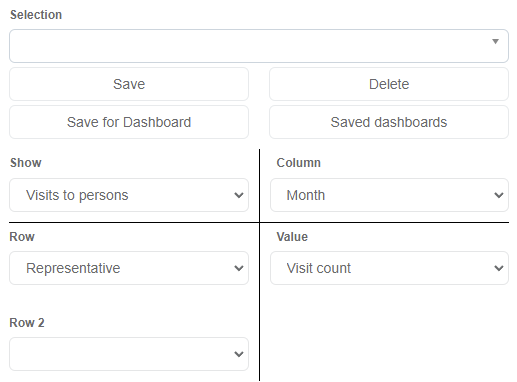
There are some filters that can be used to select the desired Marketing plan and the time gap. With the filters defined hit Search and the dashboard will appear.
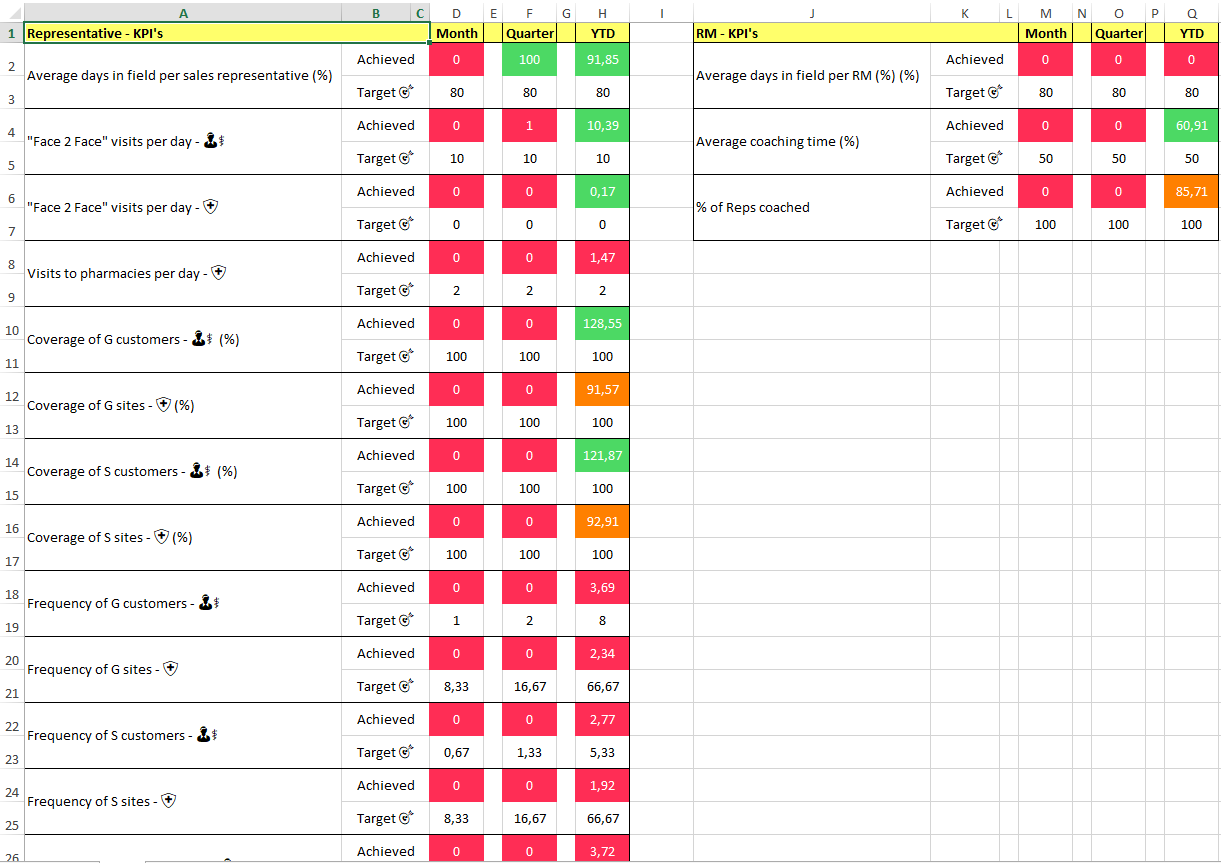
The dashboard is divided into 2 columns showing Representatives KPIs on the left and Regional Manager KPIs on the right.
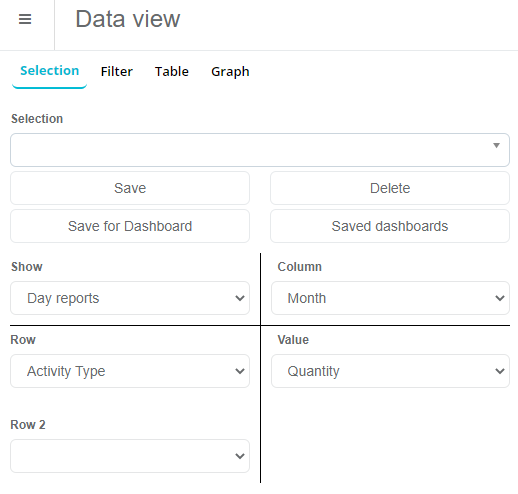
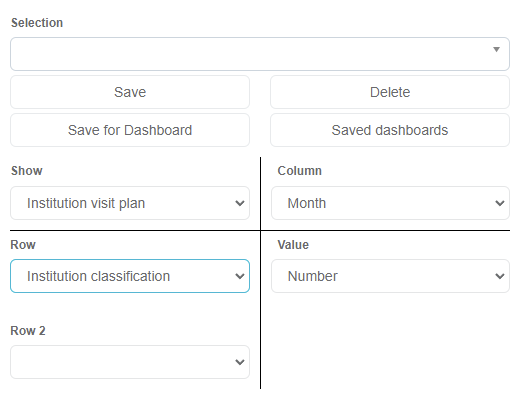
Currently, it's possible to validate the data through the Data view without the Marketing plan.
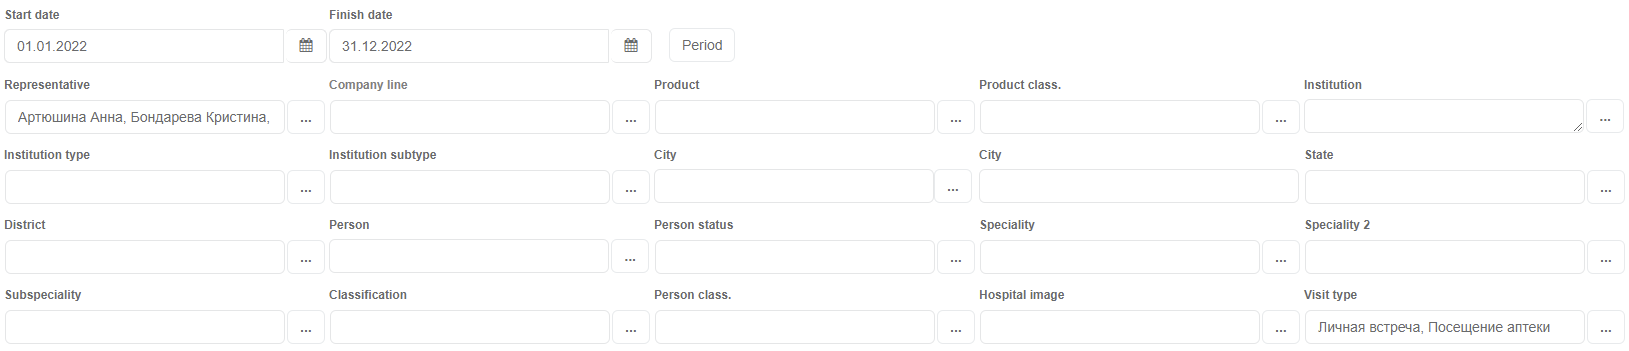
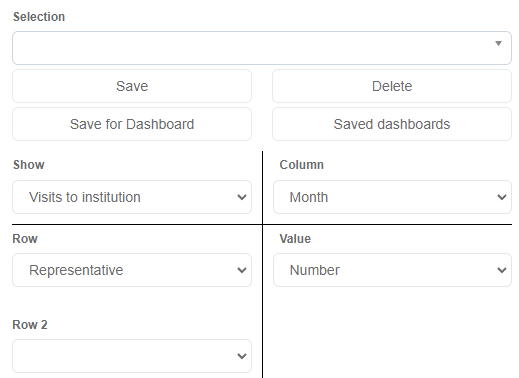
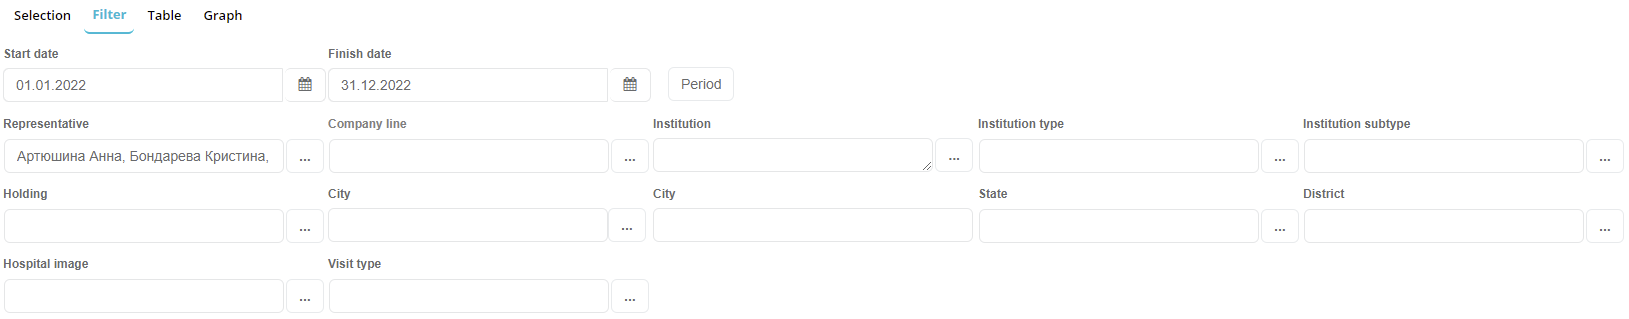
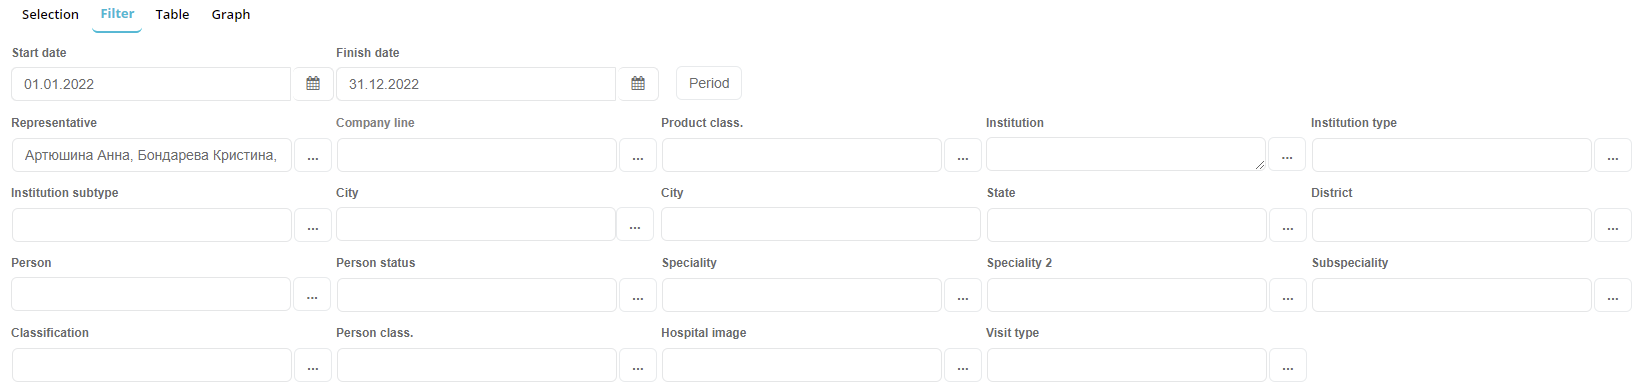
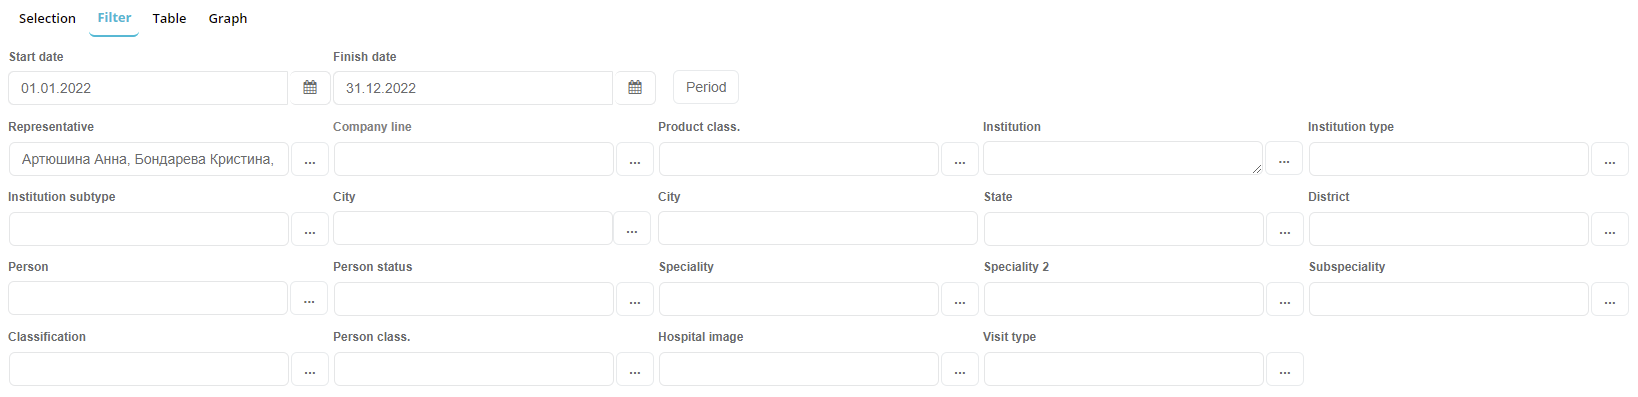
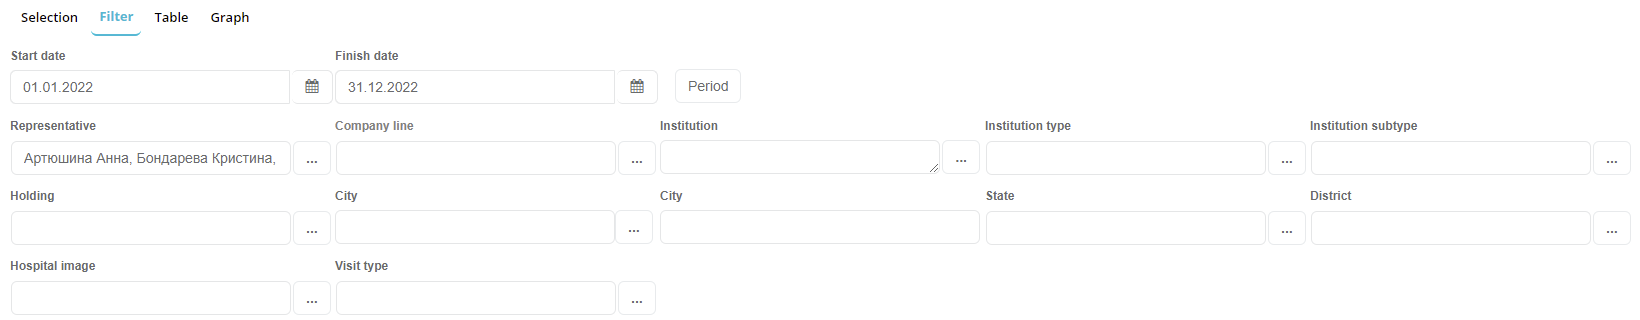
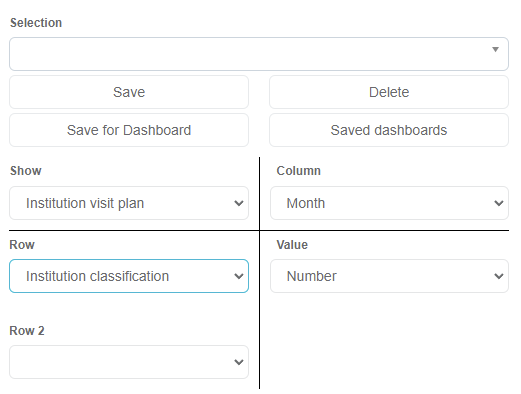
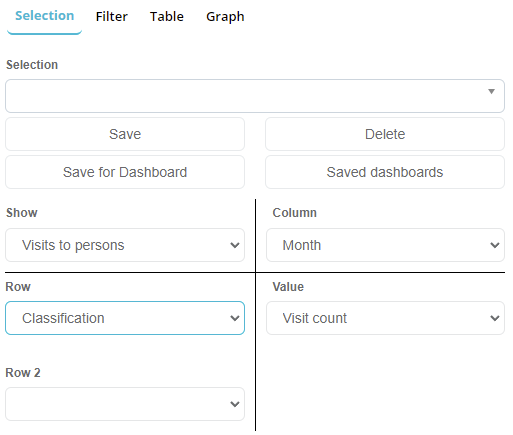
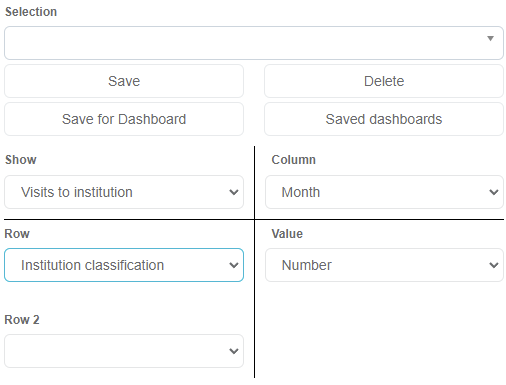
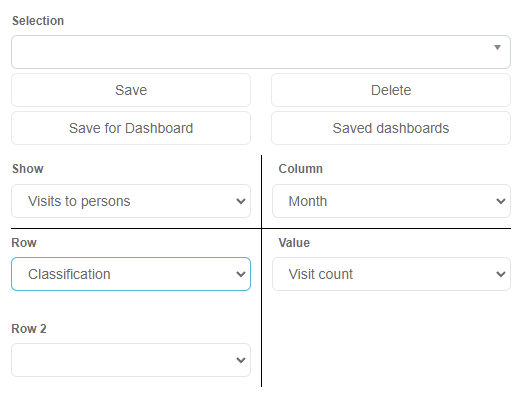
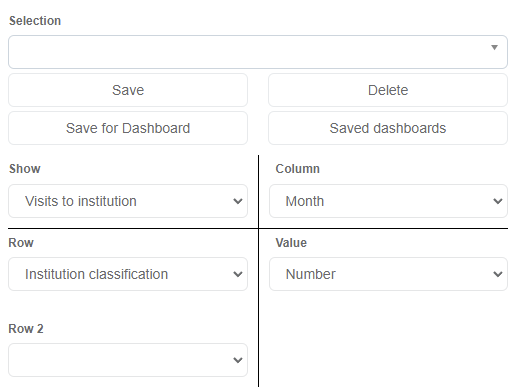
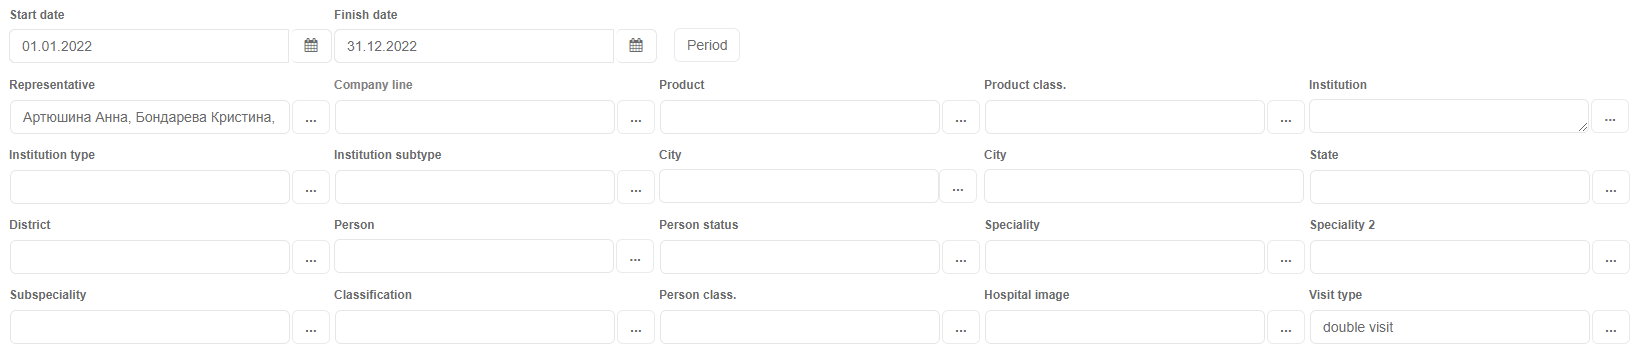
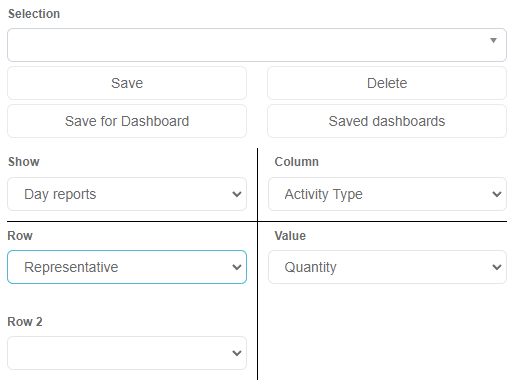
Here are the filters that will be used for the classification.
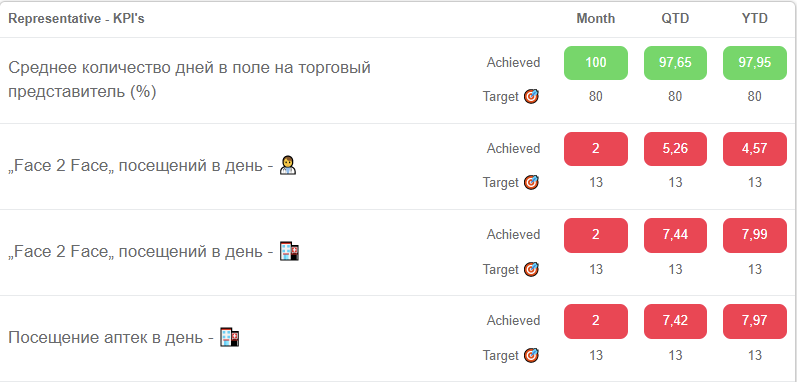
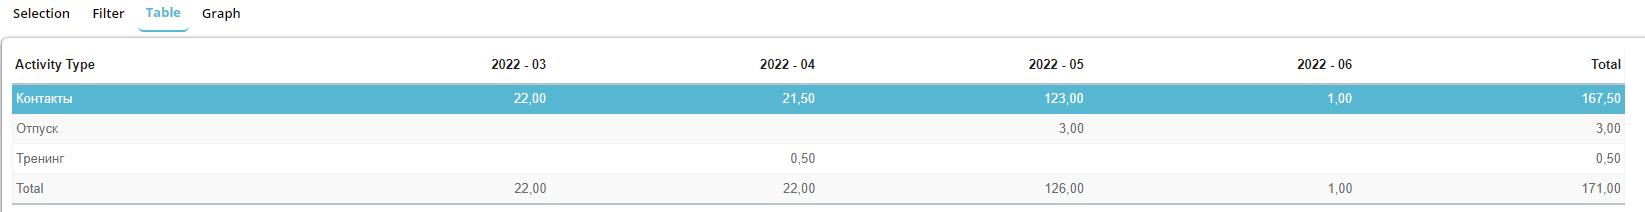
The Representative KPI's calculations for YTD: Average days in field per sales representative (%) - Total validated time reported as ‘Day in field’ (day report from option 689) / Total validated time reported (day report types from option 710) = 167,50 / 171 = 0,9795 * 100 = 97,95 %.


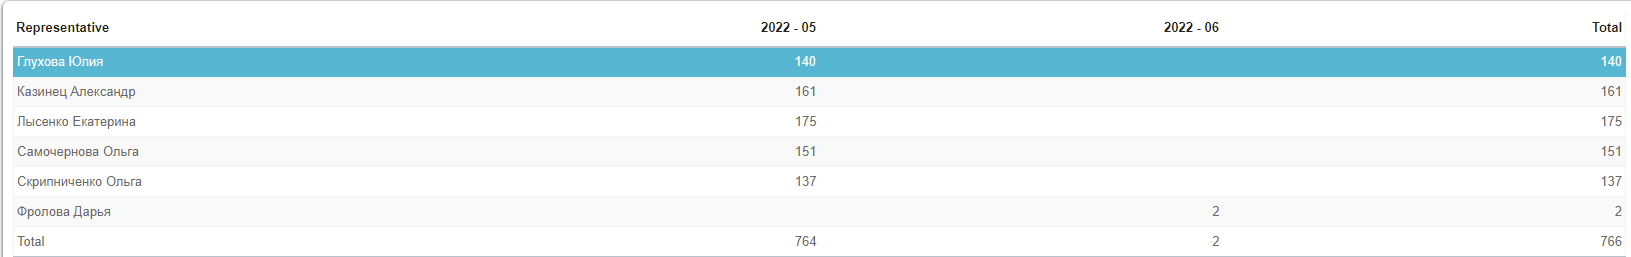
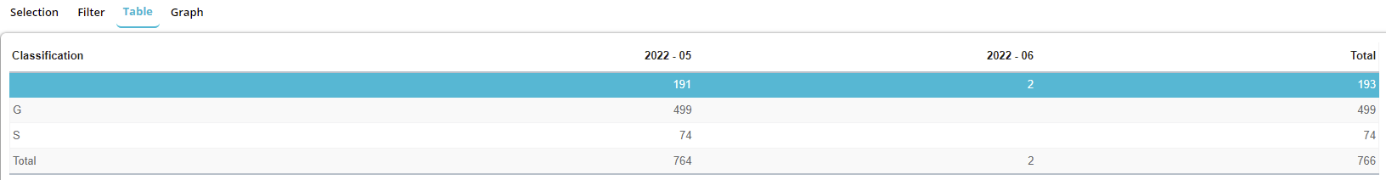
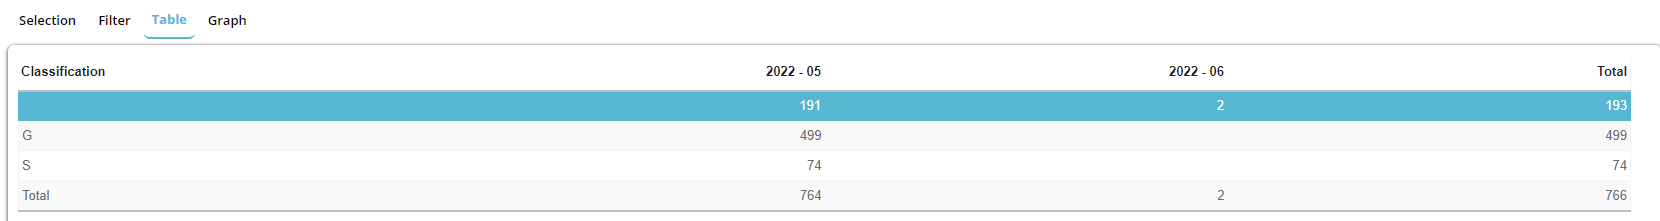
"Face 2 Face" visits per day (Persons) – Accomplished visits to the customers classified as Face to face visits (F2F visit types from option 711) / Days in Field (day report from option 689) = 766 / 167,50 = 4,57.

¸


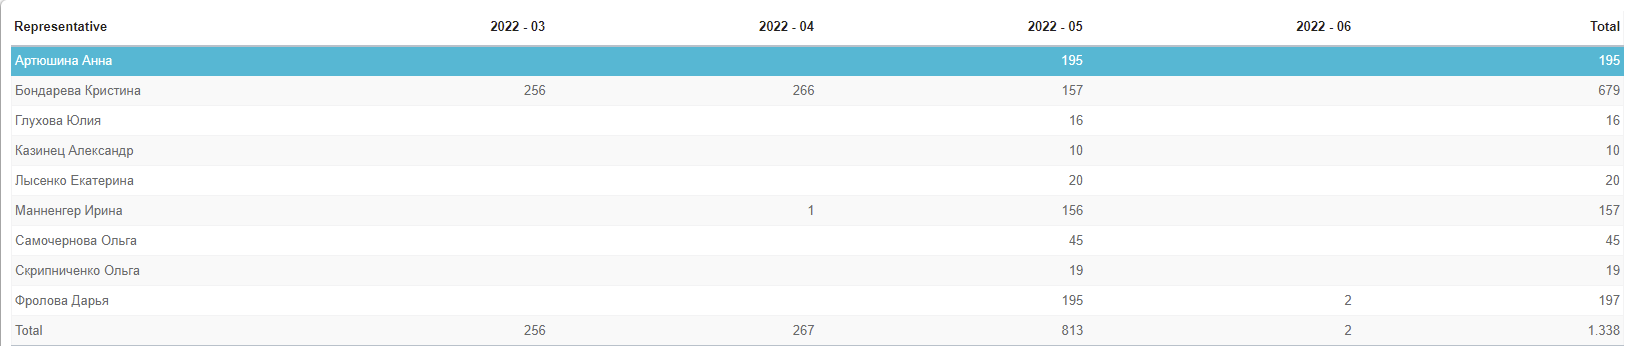
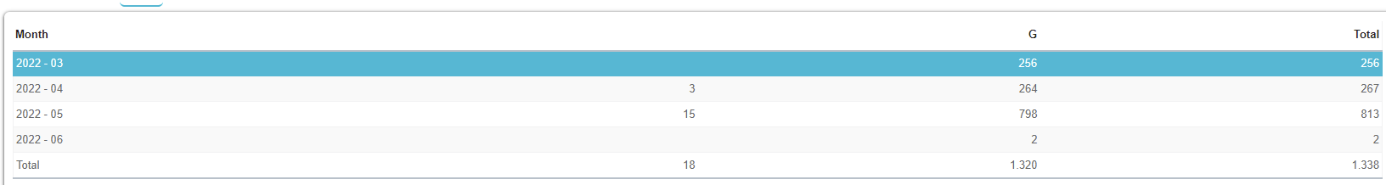
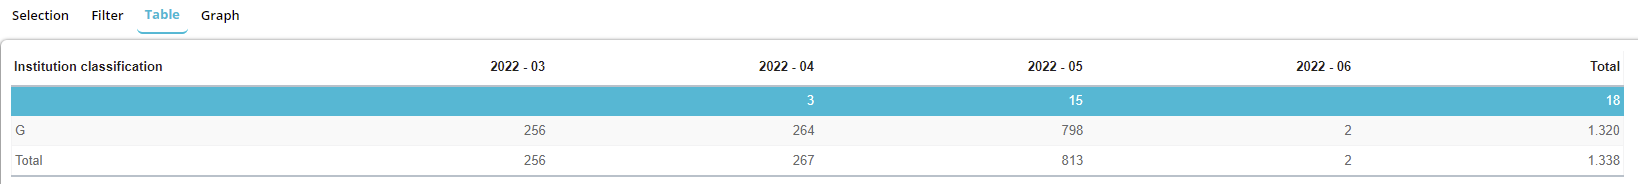
"Face 2 Face" visits per day (Institutions) - Accomplished visits to the customers classified as Face to face visits (F2F visit types from option 711) / Days in Field (day report from option 689) = 1338 / 167,50 = 7,99.


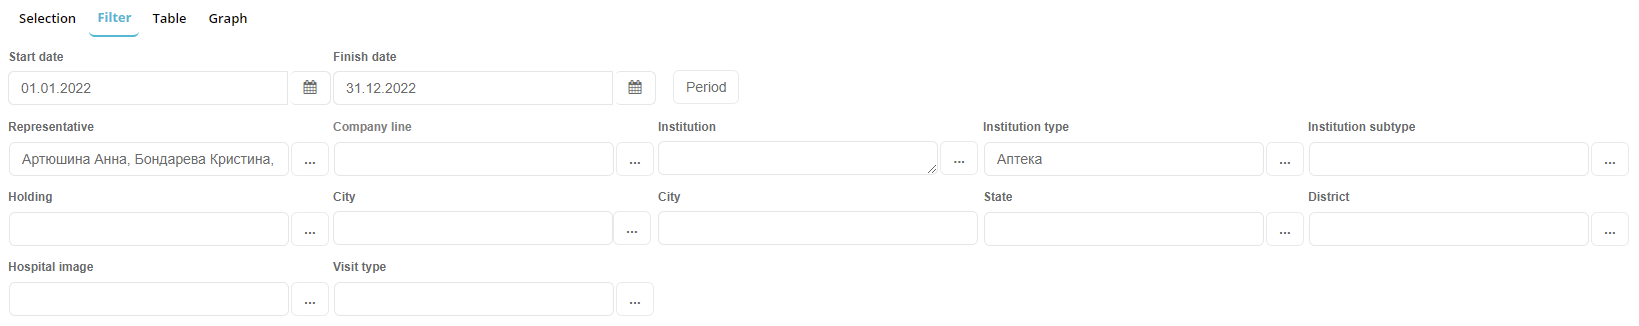
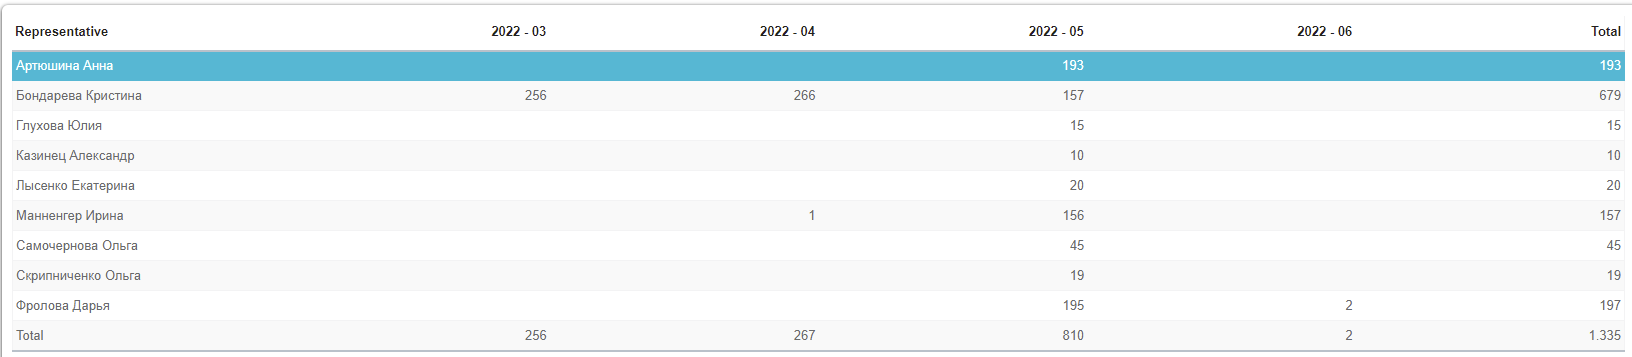
Visits to pharmacies per day (Institutions) - Total accomplished activities classified as Pharmacy visits (INST type is 2 - Apotheke) / Days in Field (day report from option 689) = 1335 / 167,50 = 7,97.

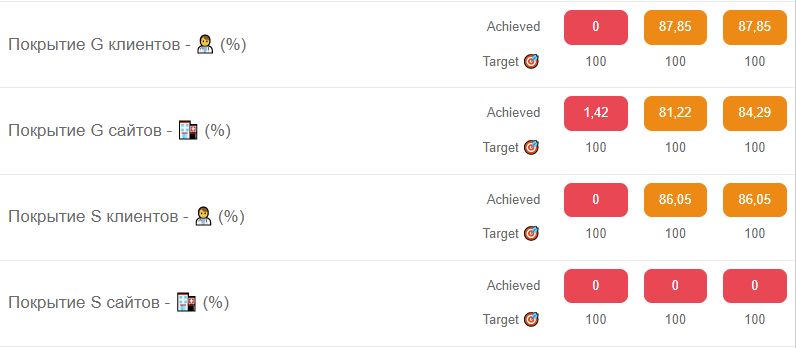
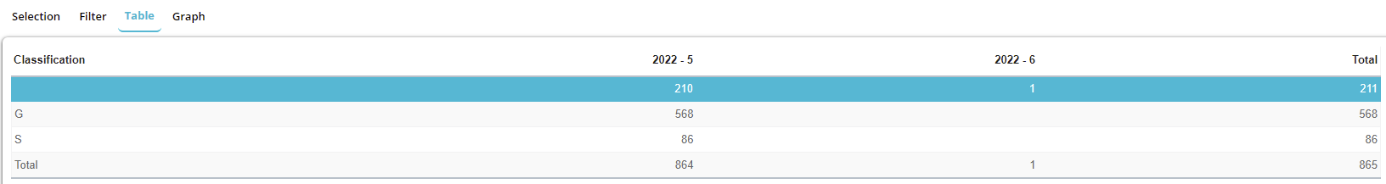
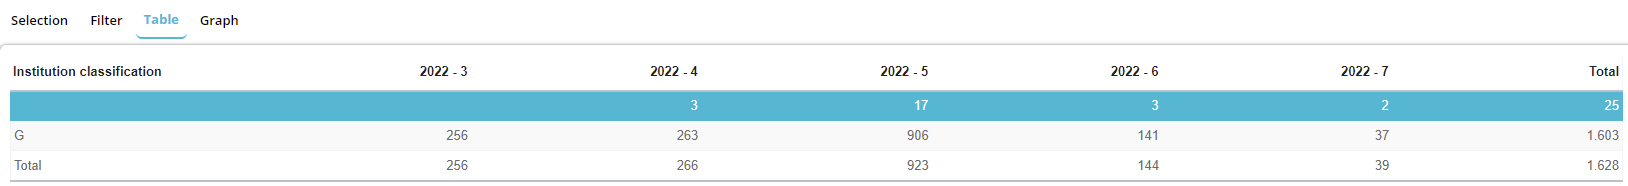
Coverage of G customers (Persons) - Number of G customers seen (visits) / number of G customers planned (plan) on the territory of the user = 499 / 568 = 0,8785 * 100 = 87,85 %.

Coverage of G sites (Institutions) - Number of G customers seen (visits) / number of G customers planned (plan) on the territory of the user = 1320 / 1603 = 0,8234 * 100 = 82,34 %.
Coverage of S customers (Persons) - Number of S customers seen (visits) / number of S customers planned (plan) on the territory of the user = 74 / 86 = 0,86046 * 100 = 86,05 %.


Coverage of S sites (Institutions) - Number of S customers seen (visits) / number of S customers planned (plan) on the territory of the user = 0 / 0 = 0 %.


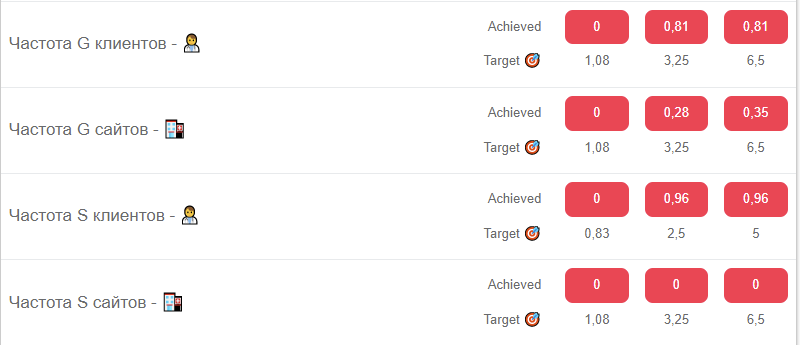
Frequency of G customers (Persons) – Total of accomplished G customers visits on territory / Total number of G customers on territory of the user = 499 / 608 = 0,81.

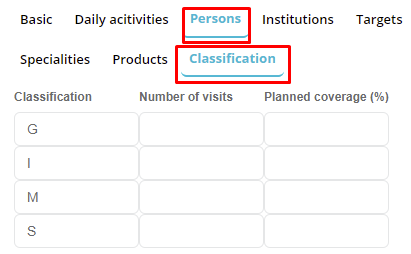
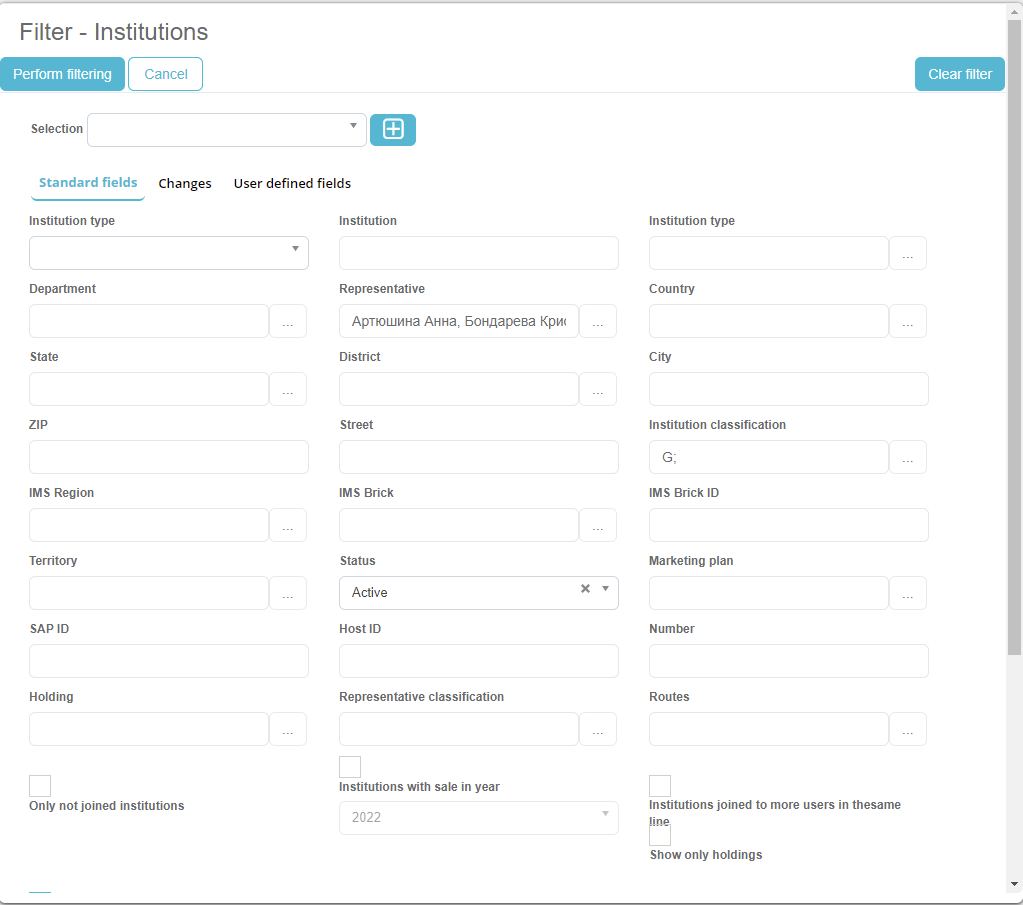
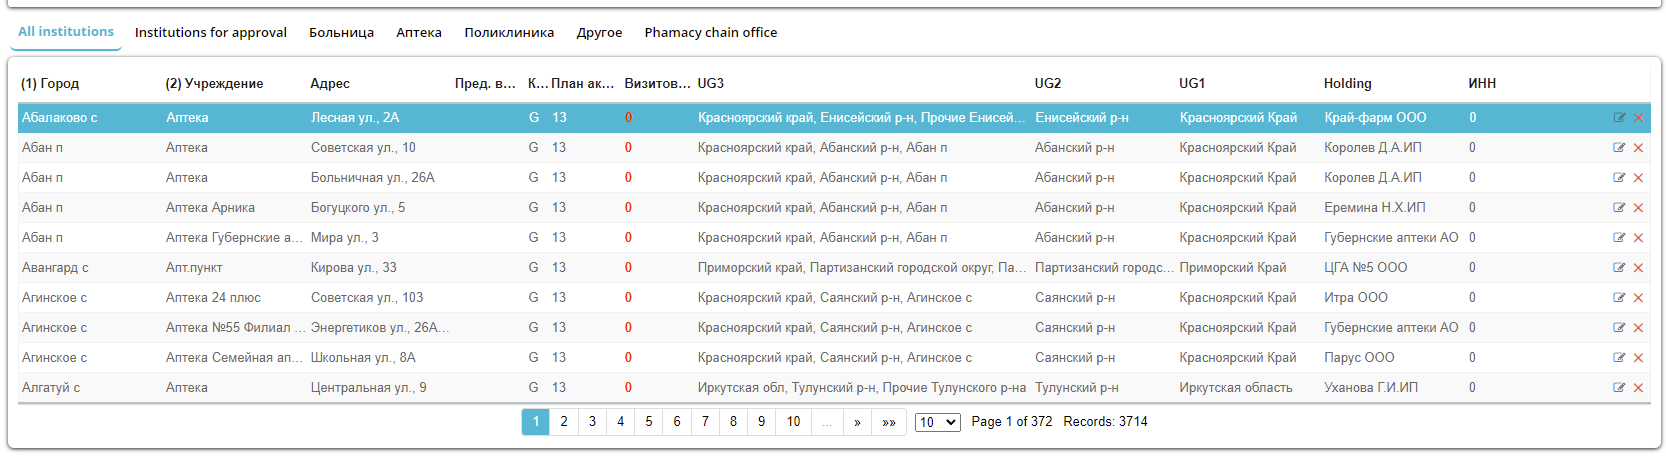
For the calculation of Total number of G customers on the territory of the user we go to module Persons where we according to the classifications calculate the total number of G classified persons.
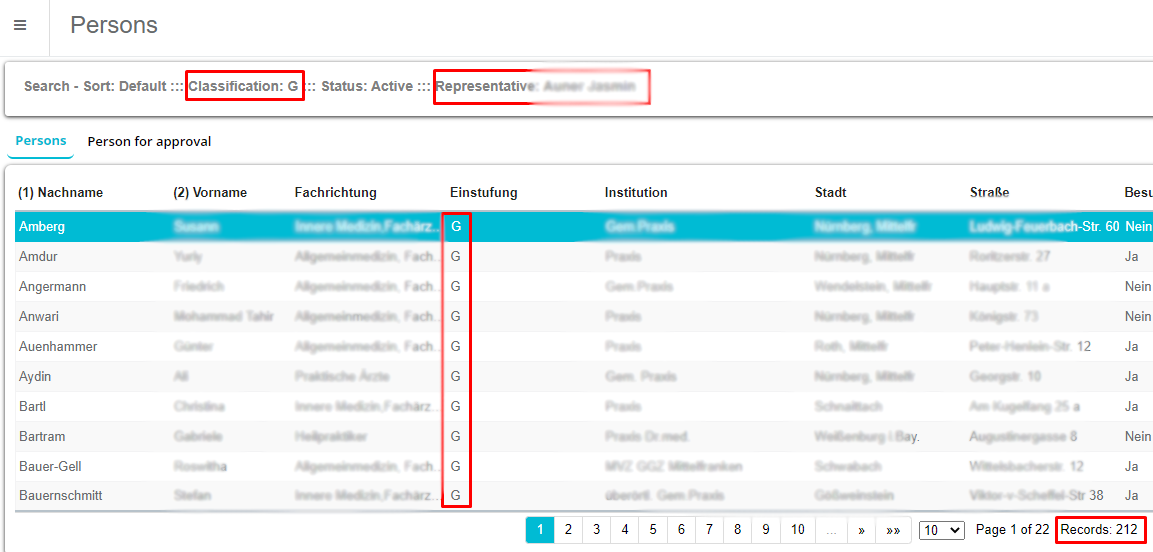
Since the territory is shared we get the following : 244 + 109 +166 + 89 = 608.
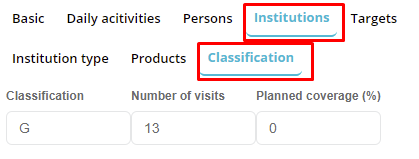
Frequency of G sites (Institutions) – Total of accomplished G customers visits on territory / Total number of G customers on territory of the user = 1320 / 3714 = 0,35.

Frequency of S customers (Persons) - Total of accomplished S customers visits on territory / Total number of S customers on territory of the user = 74 / 77 = 0,96.
For the calculation of Total number of S customers on the territory of the user we go to module Persons where we according to the classifications calculate the total number of S classified persons.
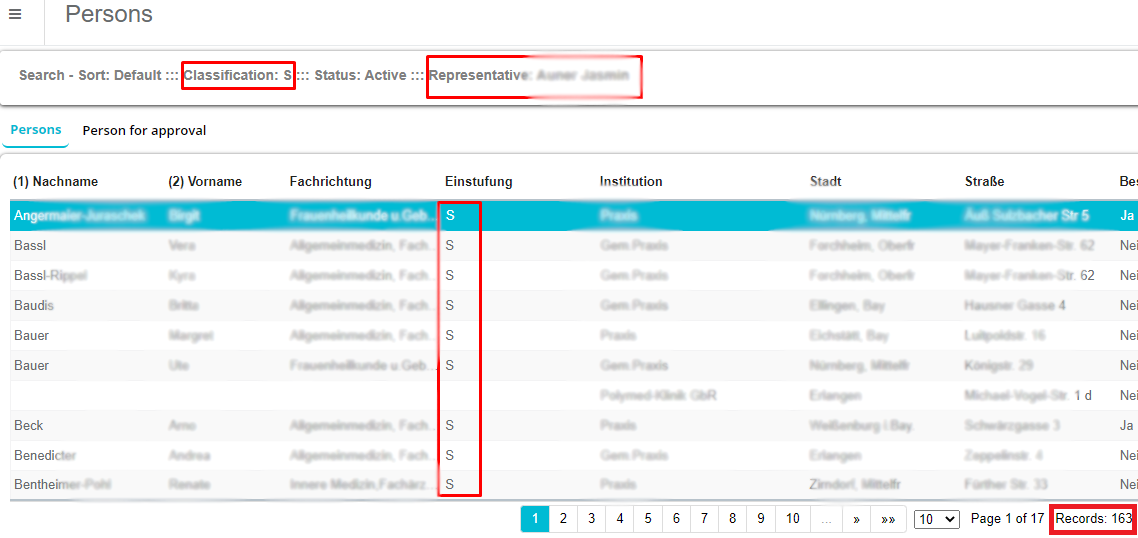
Since the territory is shared we get the following : 29 + 36 + 12 = 77.
Frequency of S sites (Institutions) – Total of accomplished S customers visits on territory / Total number of S customers on territory of the user = 0 / 0 (since there are no Institutions classified as S) = 0.

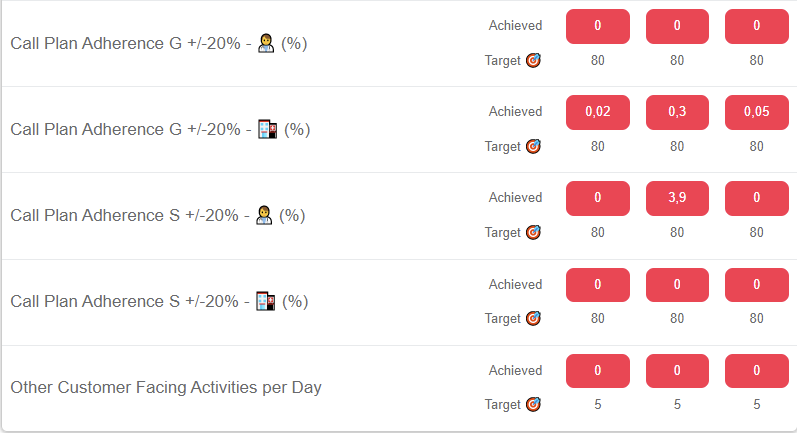
Other Customer Facing Activities per Day - Accomplished visits to the customers (both persons and institution visits) where visit type is different then types from option 711 and institution type is different then Pharmacy / Days in Field (day report from option 689). = 0 / 167,50 = 0.

That is all regarding the Representative KPIs. Now let’s switch to the RM KPIs.
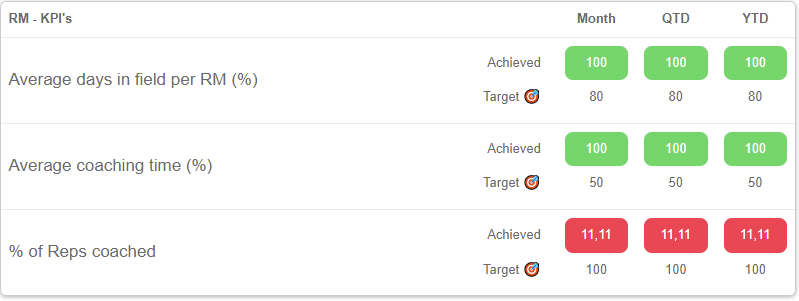
The Representative KPI's calculations for YTD: Average days in field per RM (%) - Total validated time reported by RM users as ‘Day in field’ (day report from option 689) / Total validated time reported (day report types from option 710)


Average coaching time (%) - Total validated time reported as 'Coaching' (from option 712) / Total validated time reported (day report types from option 710) = 1 / 1 = 1 * 100 = 100 %


% of Reps coached - % of reps coached by the Regional manager (Number of SR's with whom the RM is marked as an Covisit / total number of SR's assigned to the RM, expressed as percentage.)
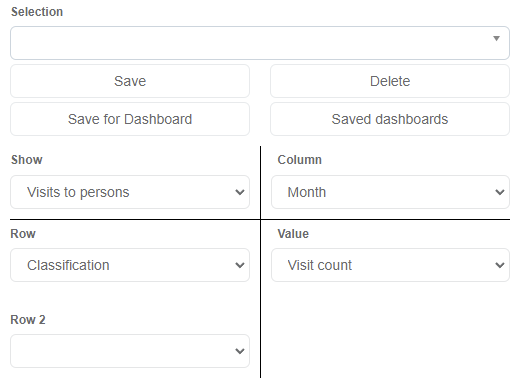
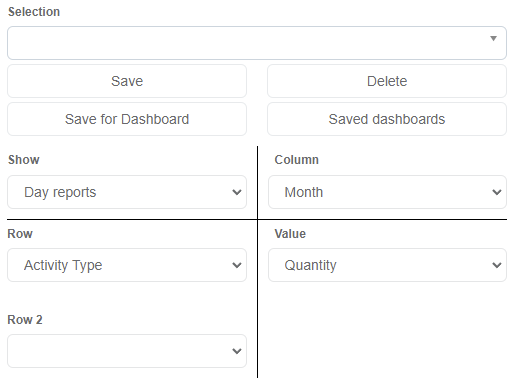
There is also a possibility to show the KPIs im form of a analysis. The analysis can be founda under Analysis -> Contacts -> SFE KPI Dashboard.
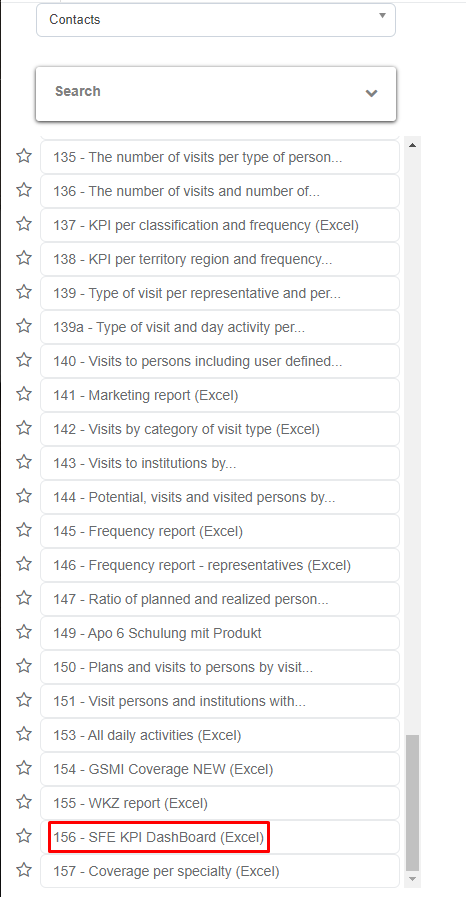
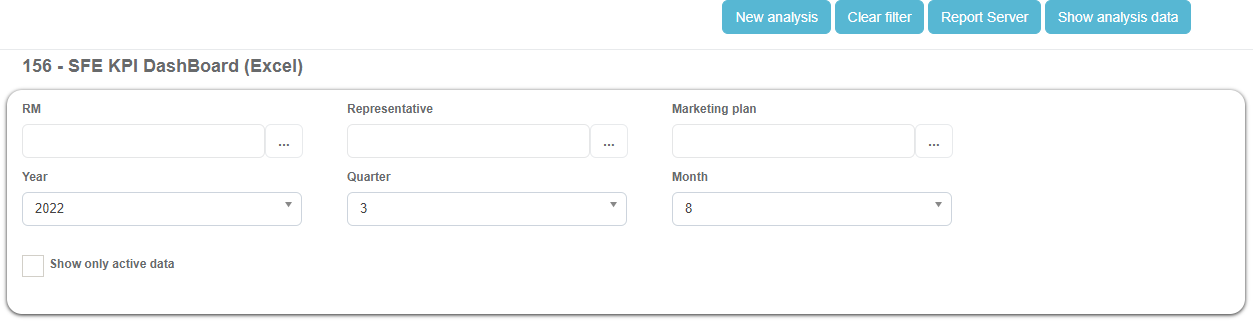
It has the standard filters and when clicked it show the KPIs directly export in the excel file.