Frequency Dashboard
For specific countries there is a Frequency Dashboard available on the homescreen containing filters like The RM, Representative, Marketing plan, Year, Quarter and Month.
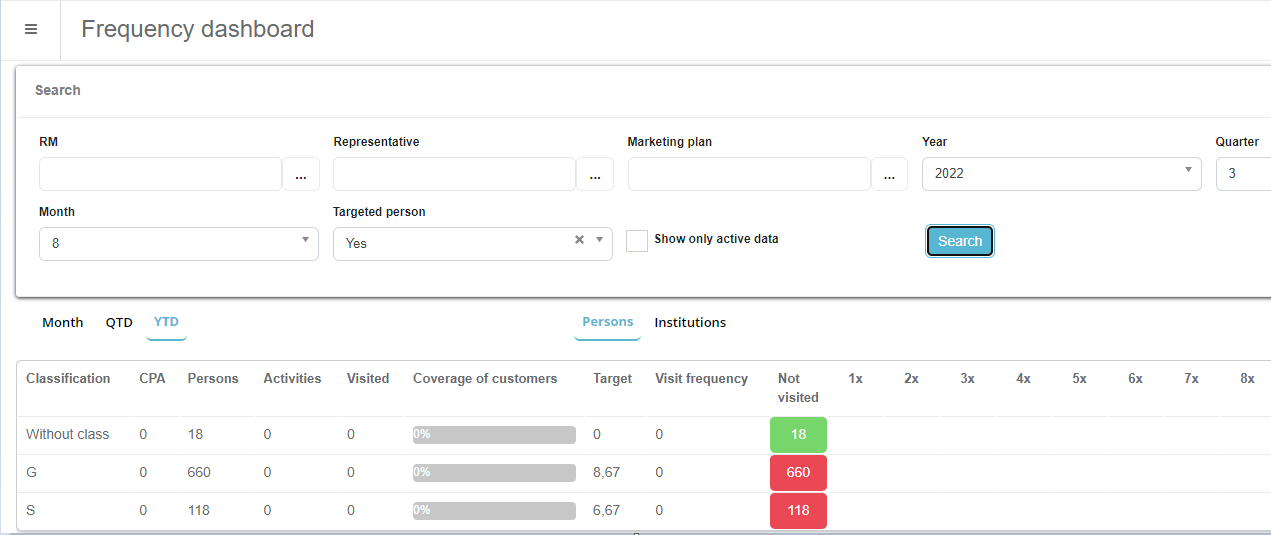
After the filter selection click on Search to get a nice overview of the data separated into 2 tabs: Persons and Institutions. Also there are possible calculation for the Month, QTD (Quarter to Date) and YTD (Year To Date).
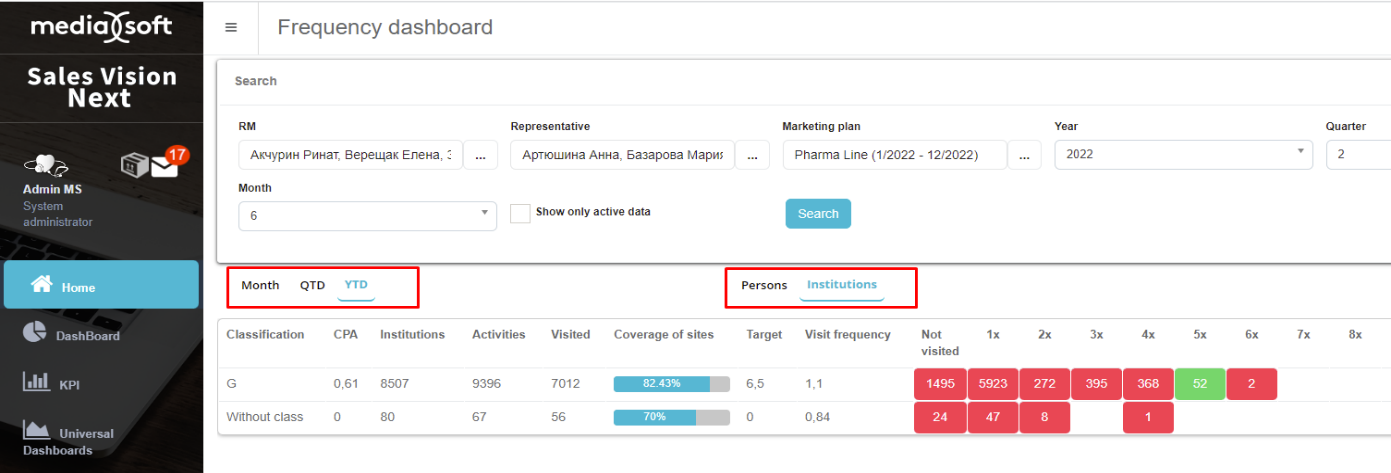
The dashboard can be switched between Persons and Institutions and through time in form of a Month QTD (Quarter To Date) and YTD (Year To Date). For this dashboard, some definitions must be predefined in the Admin part. Now, let’s explain the data on the dashboard: Classification – general classification defined in system admin
CPA (Call Plan Adherence) – % of visited customers on territory within the +/- 20% of the target call frequency vs. total number of customers on the territory per classification
Institutions – number of institutions in the user’s territory per classification
Activities – Sum of Number Of Visits * Number Of Customers = 1 * 5923 + 2 * 272 + 3 * 395 + 4 * 368 + 5 * 52 + 6 * 2 = 5923 + 544 + 1185 + 1472 + 260 + 12 = 9396
= 47 * 1 + 8 * 2 + 4 * 1 = 47 + 16 + 4 = 47
Visited – Total number of customers per classification visited at least once = 5923 + 272 + 395 + 368 + 52 + 2 = 7012 = 47 + 8 + 1 = 56
Coverage of sites – ratio of seen customers to the total number of customers in the territory per classification = 7012 / 8507 = 0,82426 * 100 = 82,43 % = 56 / 80 = 0,7 * 100 = 70 % Target – (Target defined in the Marketing plan or the option / 12) * Selected month = (13 / 12) * 6 = 6,5 = (0 / 12) * 6 = 0
Visit frequency – Number of Activities / Number of Institutions
= 9396 / 8507 = 1,1
= 67 / 80 = 0,84.