Dashboard
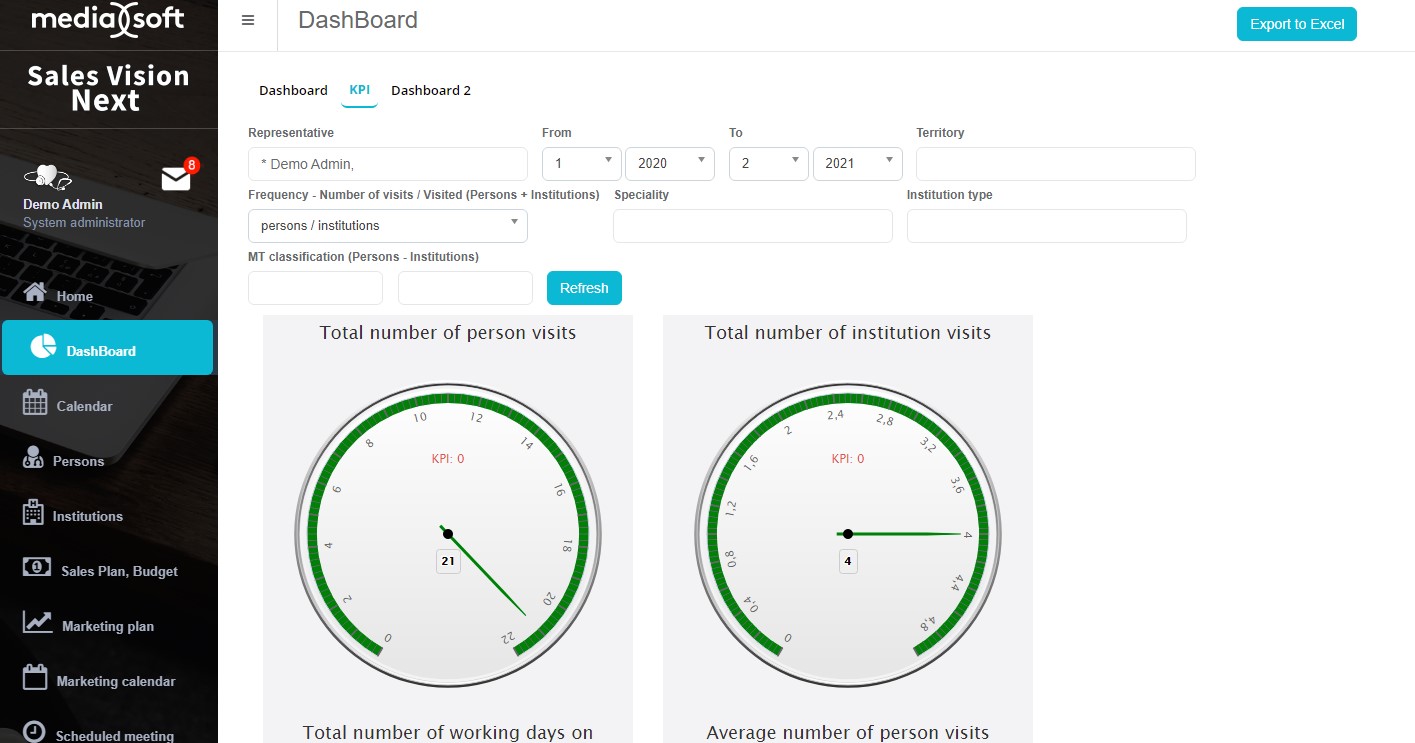
Dashboard is the module where you can see various graphics diagrams about various data such as sales/sales plan comparison, planned visits/potential market shares (from data view or predefined) etc. In the main menu, click on the icon Dashboard in order to access the module. Dashboards are predefined graphical charts, where you can ad hoc see your results according to the KPI. This is how the Dashboard module looks like when you open it and want to preview dashboard as enlarged.