Analysis
To enter the Analysis module, place the pointer of the mouse on Analysis and when the sub-menu opens, you can select one of the analysis possibility in the module.

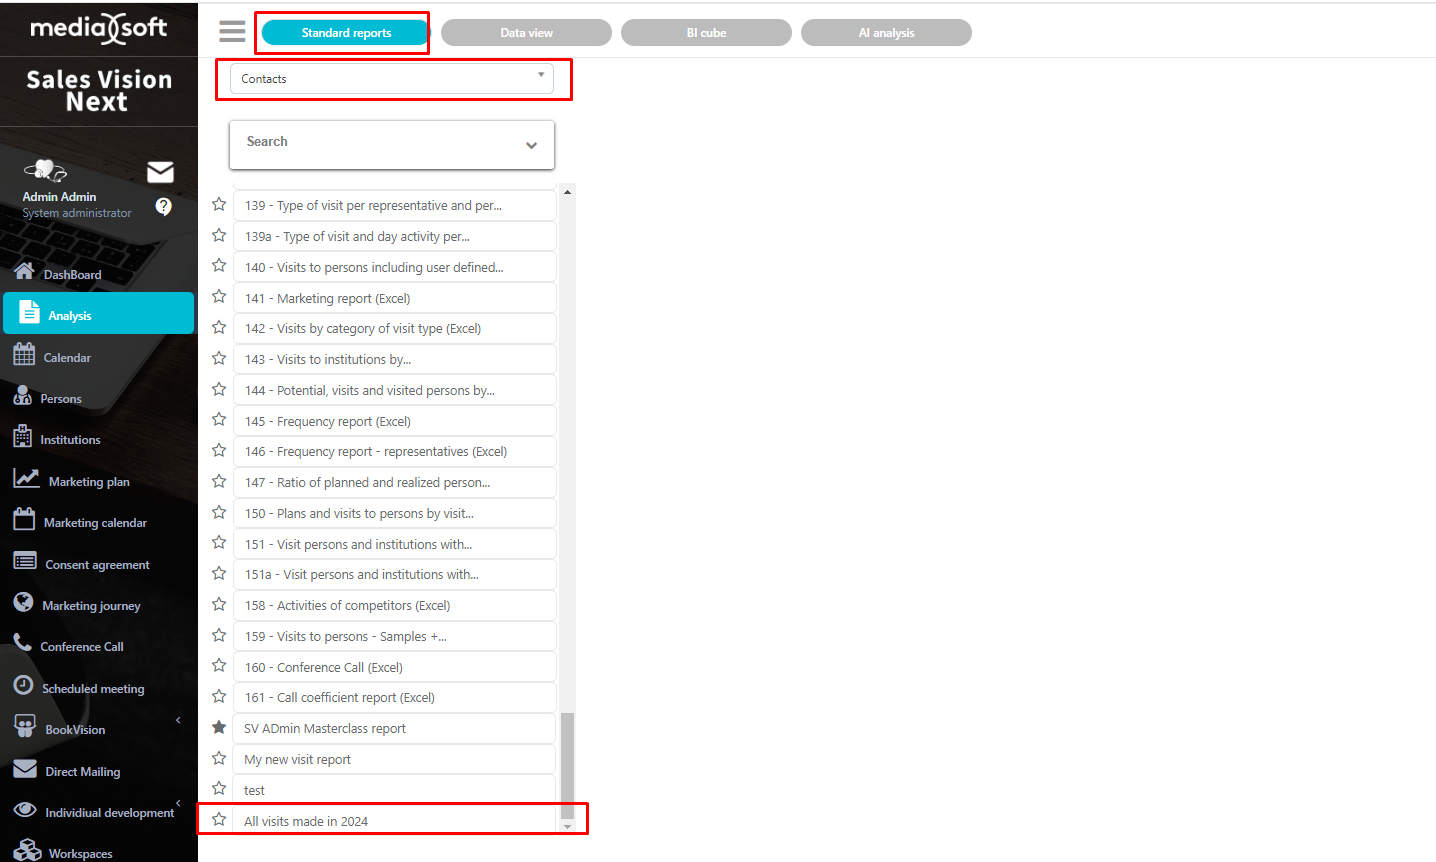
Standard reports
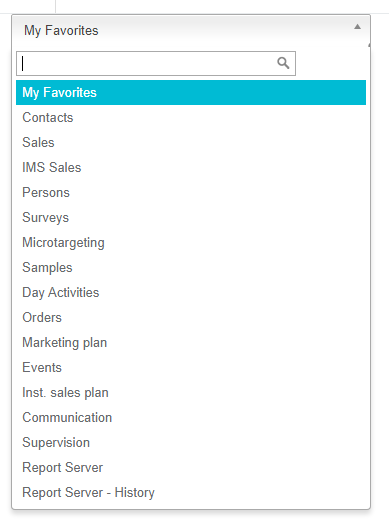
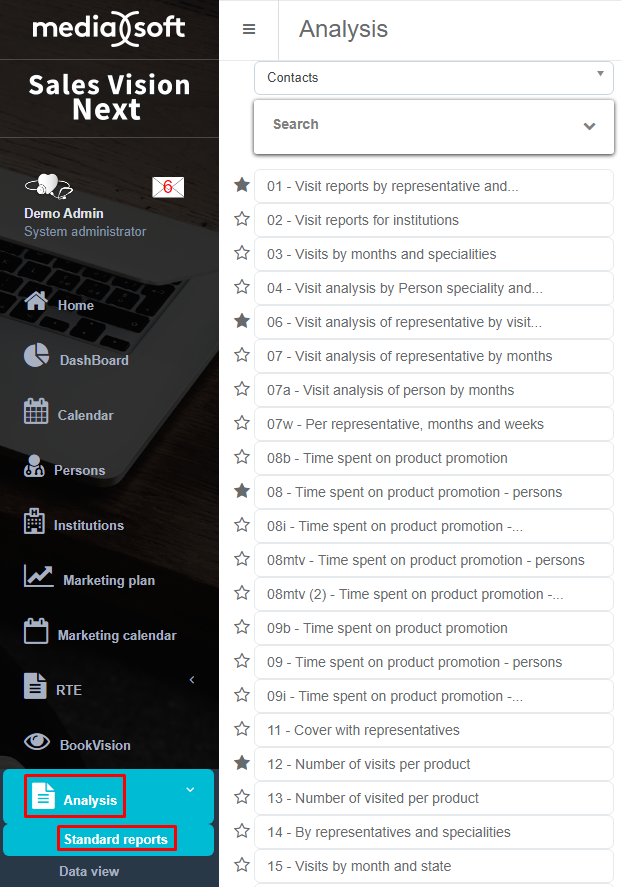
Standard reports include Contacts, Sales, MT, Stock, Orders, Report Server and so on. To run the analysis, you need to select which analysis you want to see by clicking on it on the top of the screen. These analyses are already prepared and name on the button gives you short information about what kind of results you can expect from each analysis. Contacts analyses open all the analysis for visiting contacts statistics (per representative, institution, specialty, visits and more). On the left side you can see a list of all the analysis available, and on the right side you see different filters.
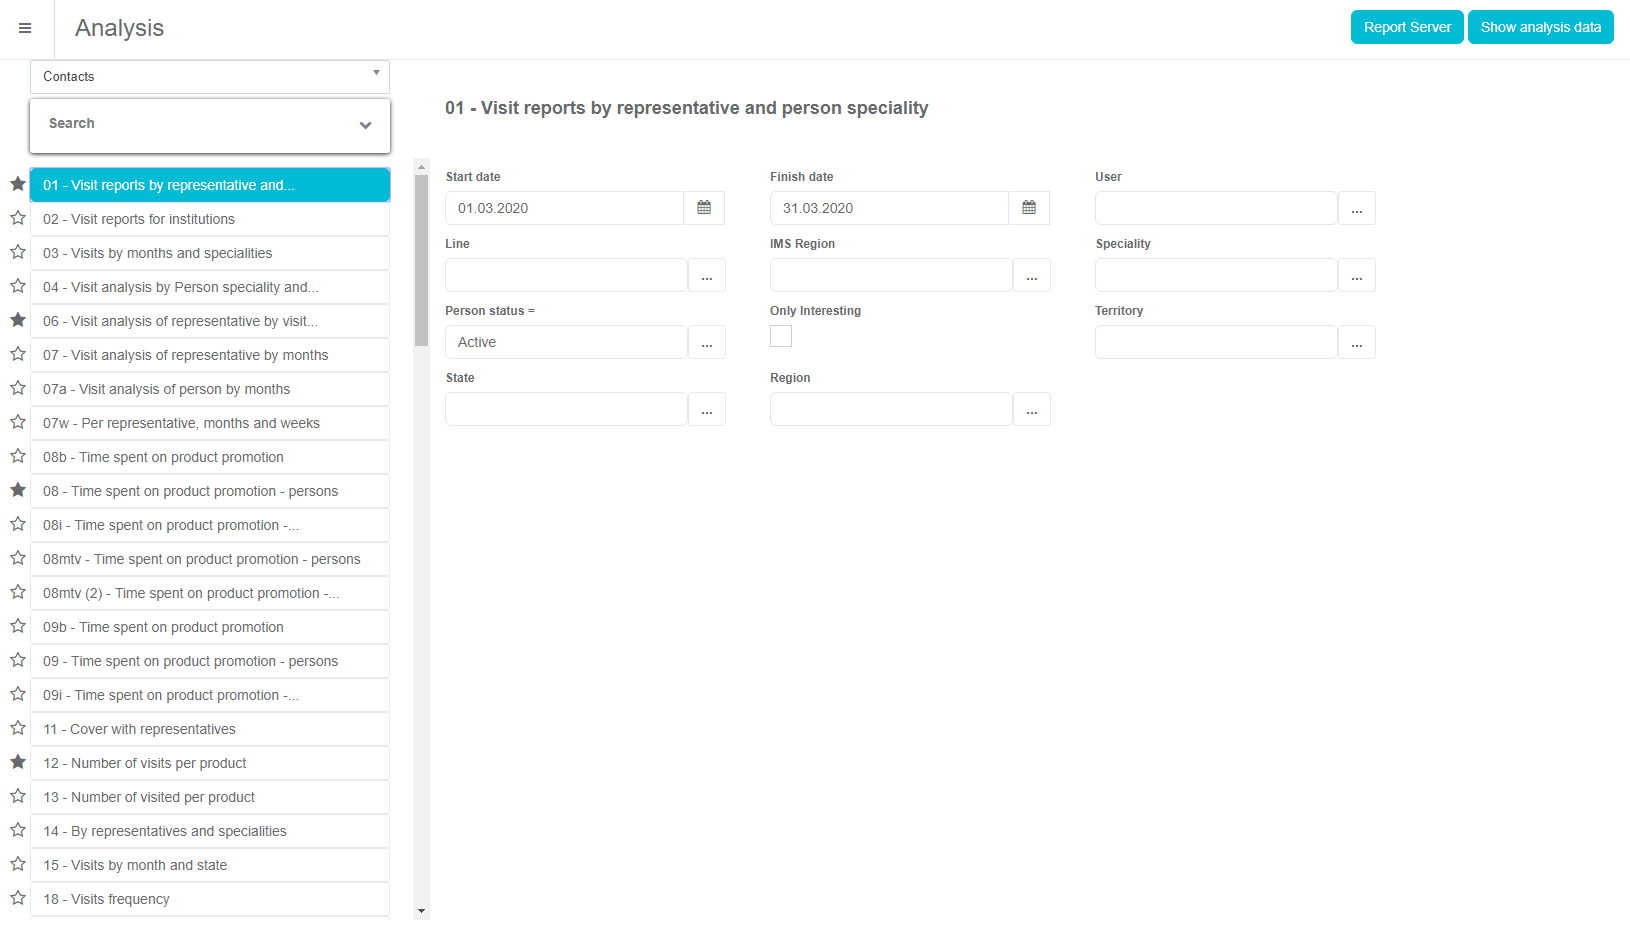
You can set up different filters and parameters for every analysis.
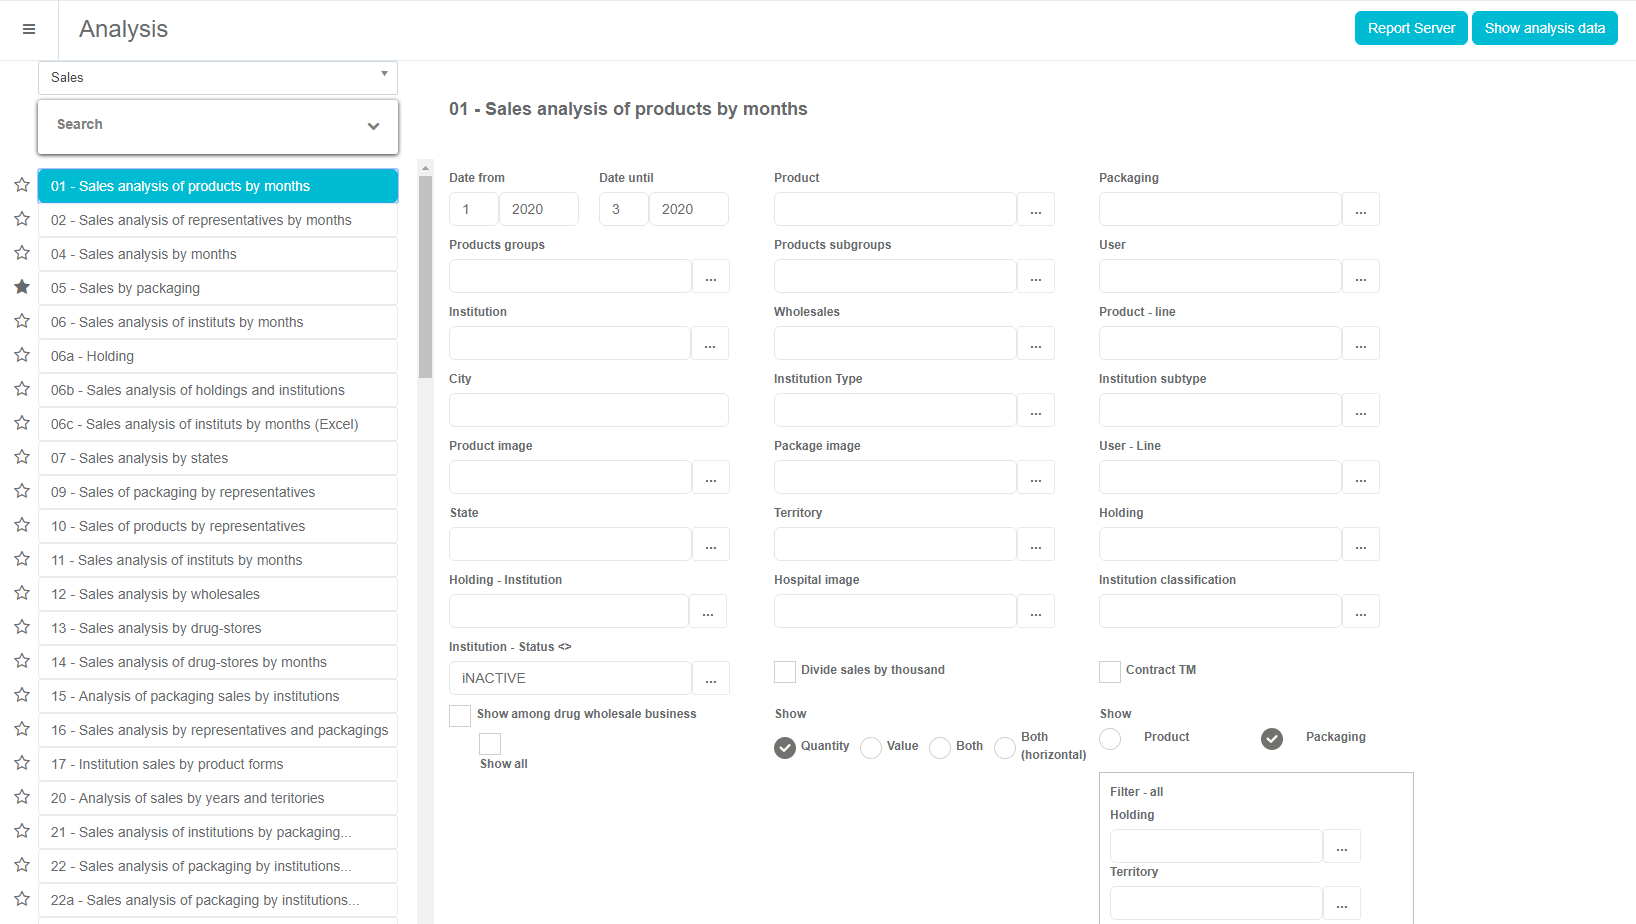
Sales analyses are similar to contact analyses, only that they are focused on sales (sales of a product, packaging, sales of institutions, wholesalers...). Each analysis from contacts and sales could be exported to a different document format (pdf, xls...). On the left side you can see a list of all the analysis available, and on the right side you can see different filters.
Microtargeting analysis runs the analysis for the Microtargeting module, like the overview of questions, answers and other data.
Marketing plan analysis runs all the analyses for the marketing plan, like overview by speciality, list of persons included in the marketing plan, plan and realization by daily activities and many more. Orders analysis runs the analysis for ordering statistics, like number of institution order according to packaging, products, different commercial offers and more. After you have chosen the analysis you want to run, entered all the filters, just click on the button Show analysis data to see the report on the screen.
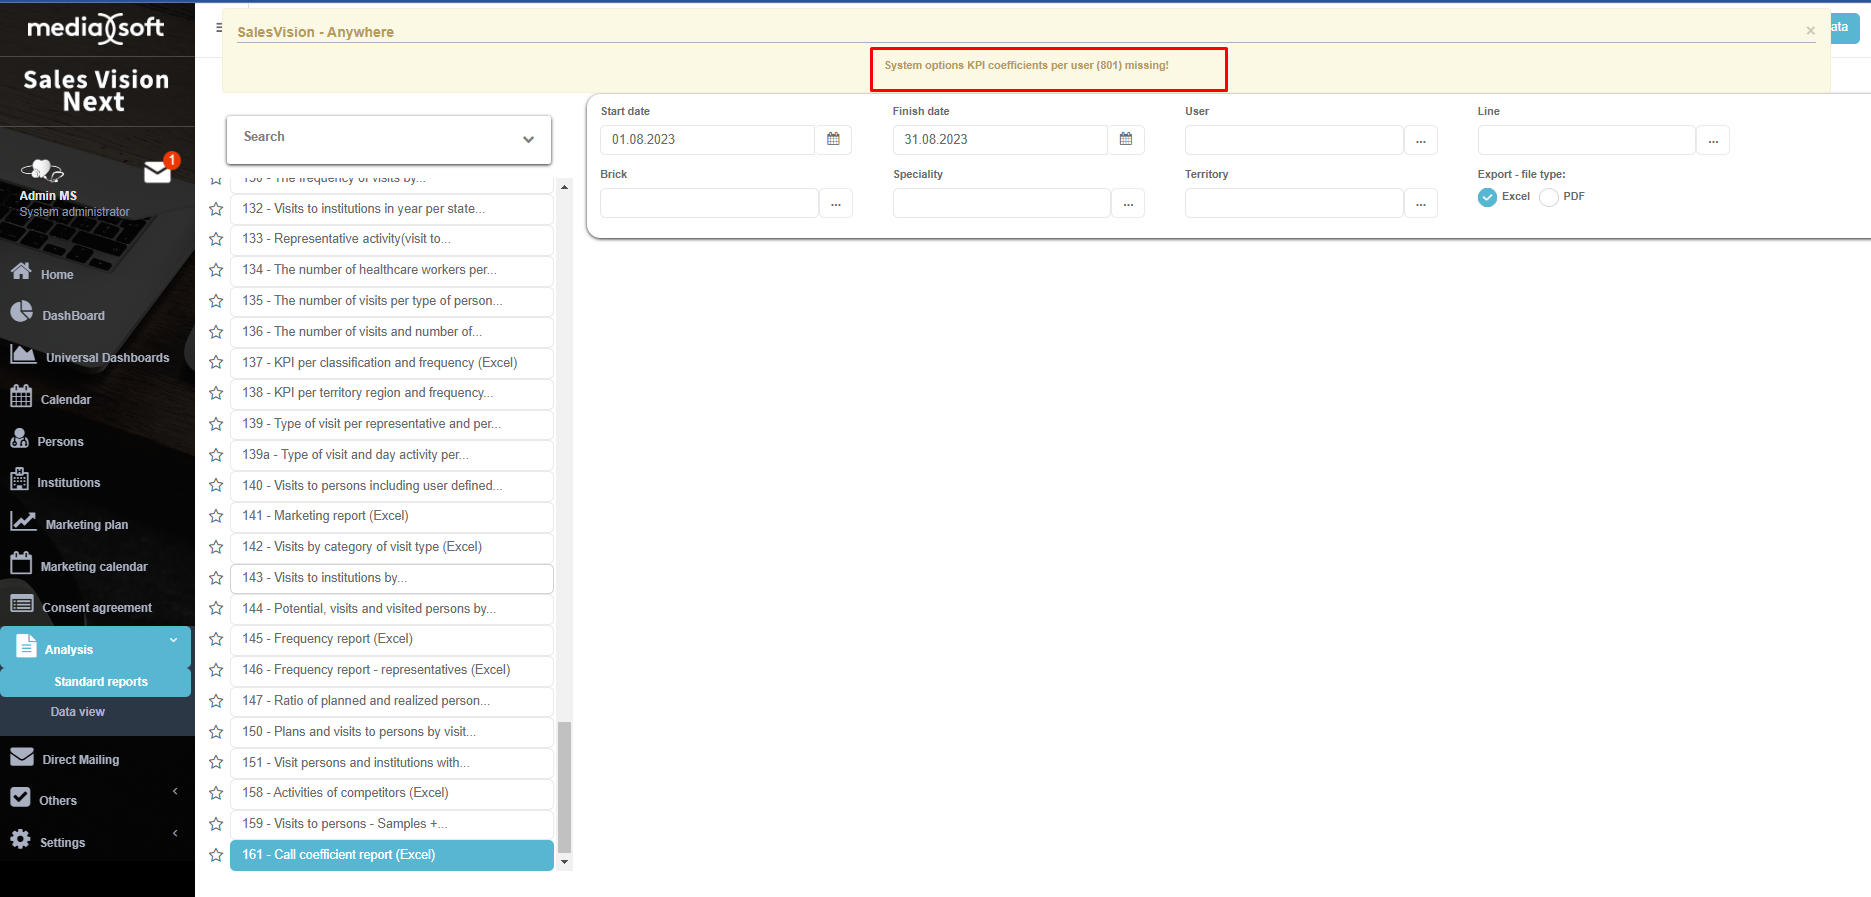
Analysis 161 - Call coeffiecient report
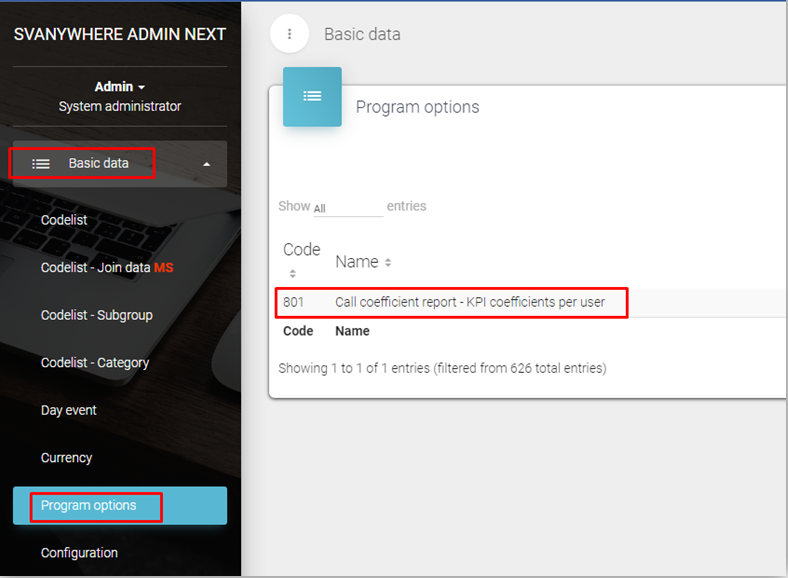
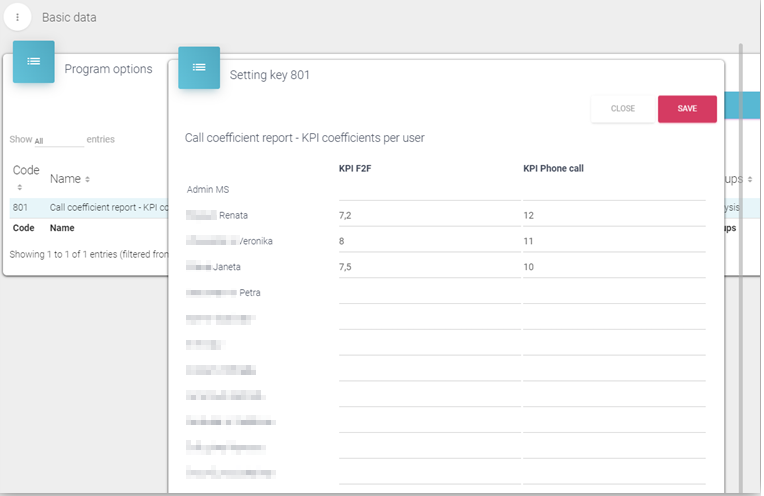
Since the new report uses KPI coefficients for "F2F" and "Phone contact" visits per each user individually, we have to define settings under "Program options" in Sales Vision Anywhere ADMIN application.
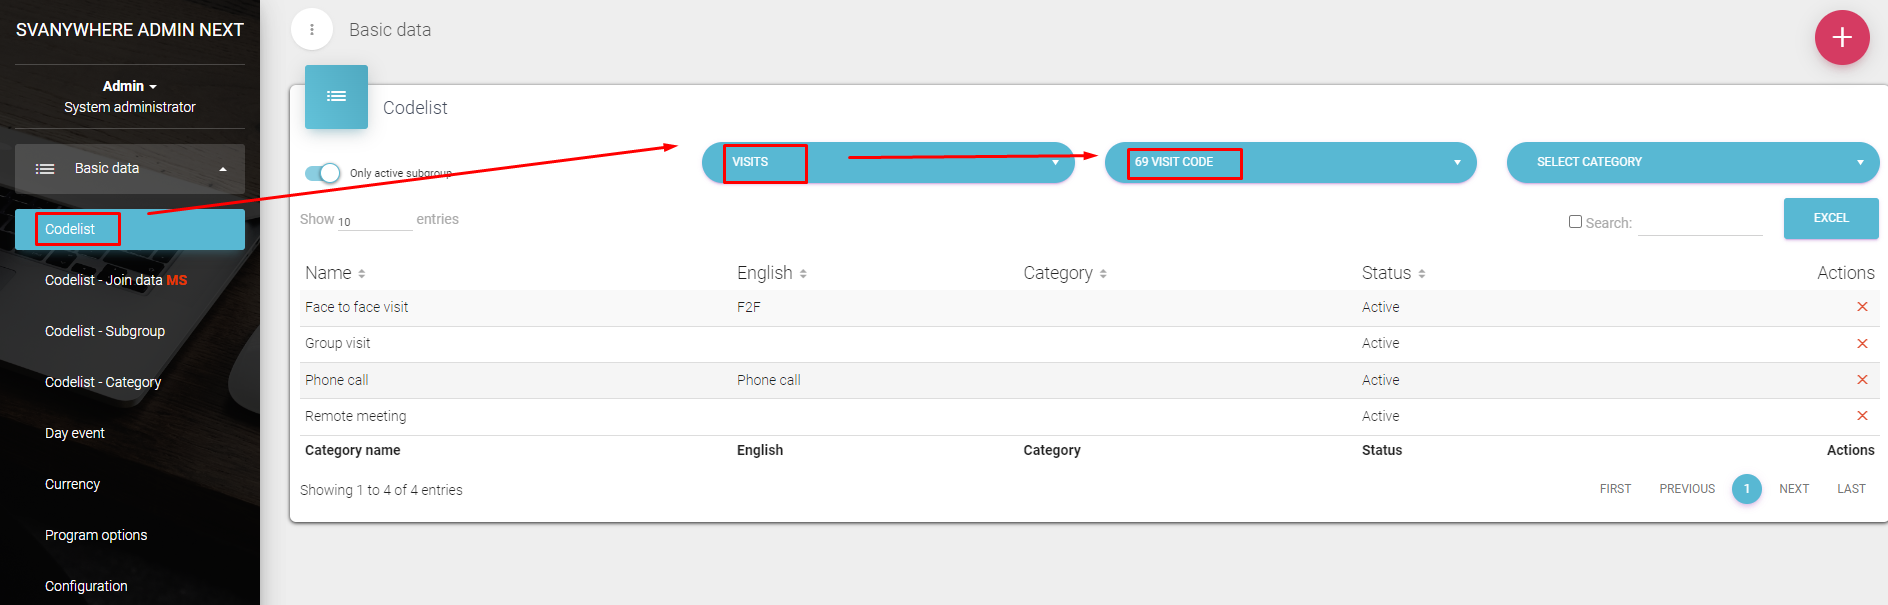
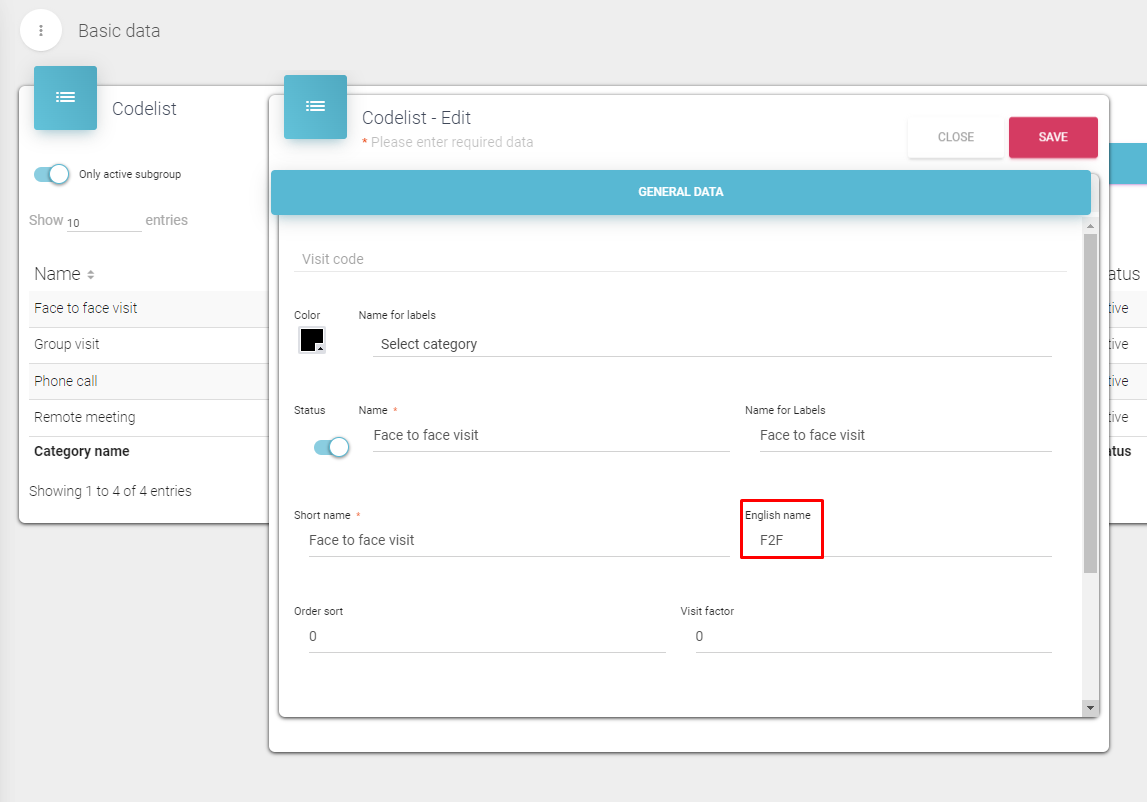
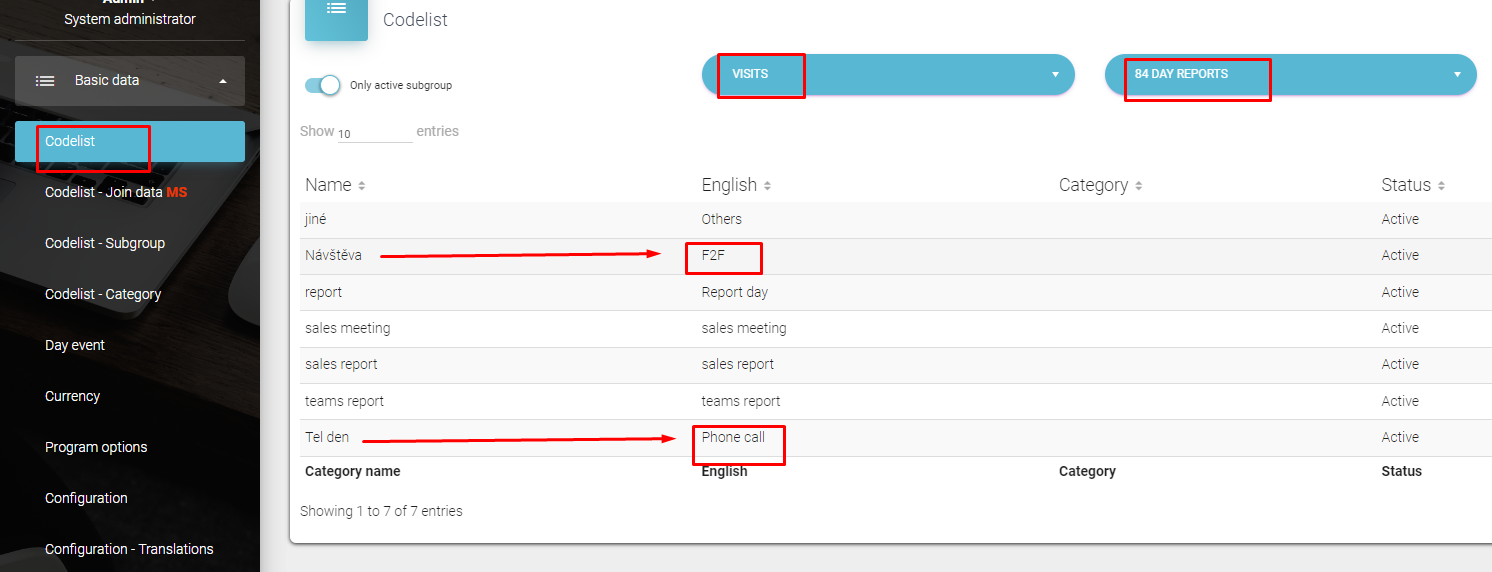
After option KPI factors have been configured, in Sales Vision Anywhere ADMIN, under Basic data Codelist Visits 69 Visit code, we have to define an "English name" to mark somehow which visit type is a "F2F visit" and which is a "Phone call" visit.
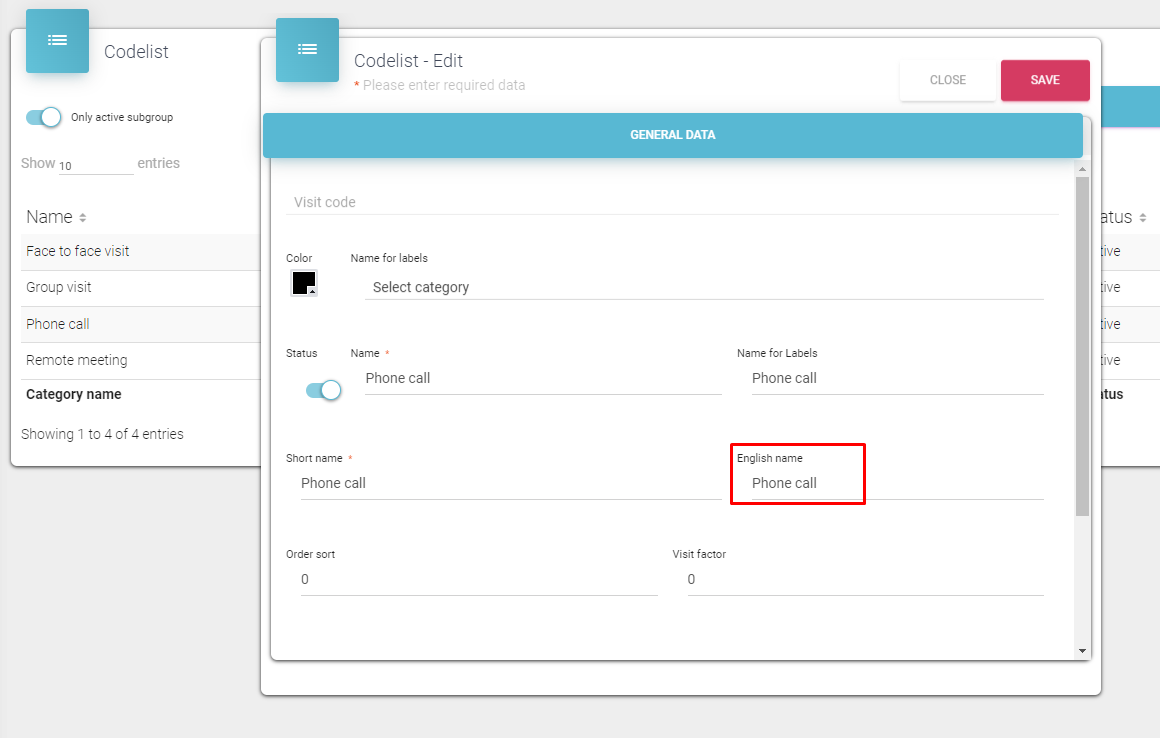
The same should be done in ADMIN application Basic data Codelist Visits Day reports, in order to mark somehow which day activity is a F2F, and which "Phone call".
If the setting 801 is not defined, when trying to run the report from Sales Vision Anywhere application, user will get a message "System option KPI coefficients per user (801) missing!"
If we don't select any user, the application will display a warning message "Required selection >> User".
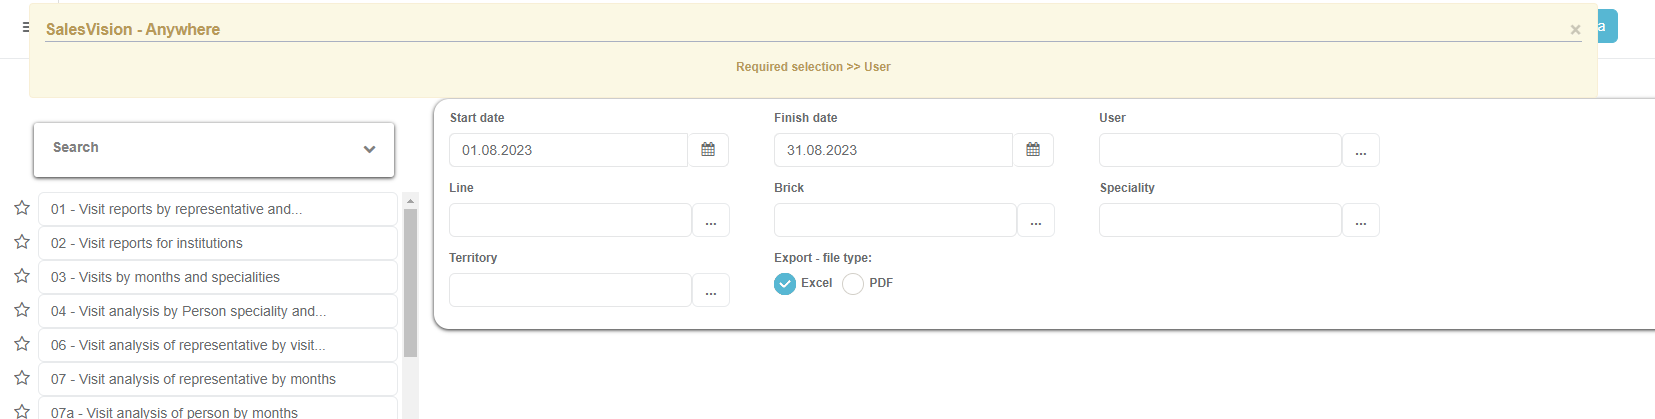
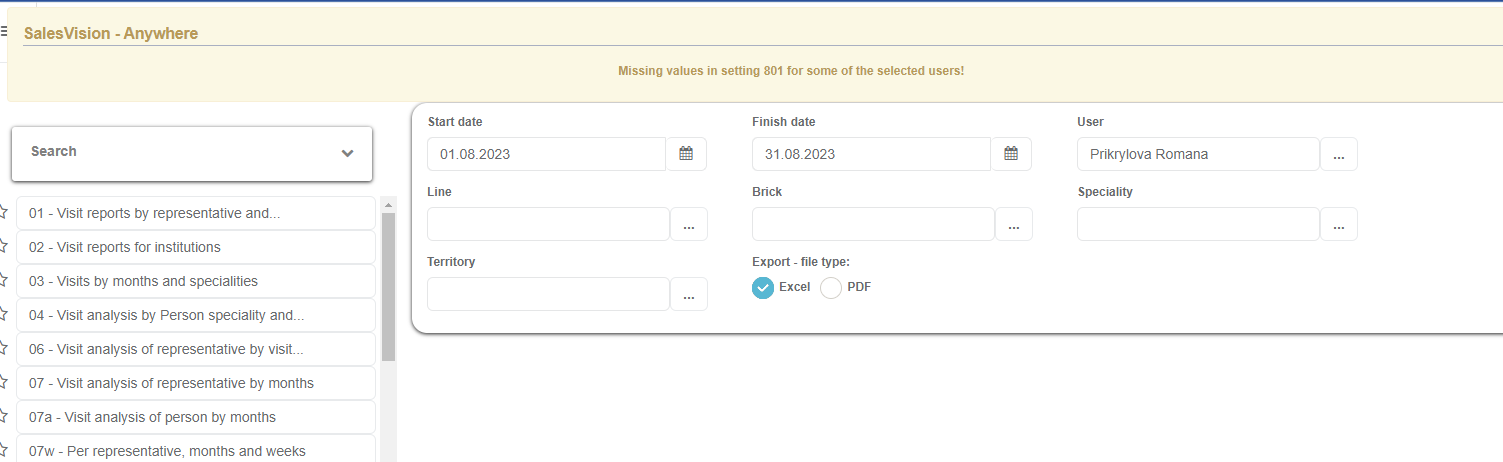
Or, if we select a user, who doesn't have KPI coefficients defined, we will get a warning message "Missing values in setting 801 for some of the selected users!".
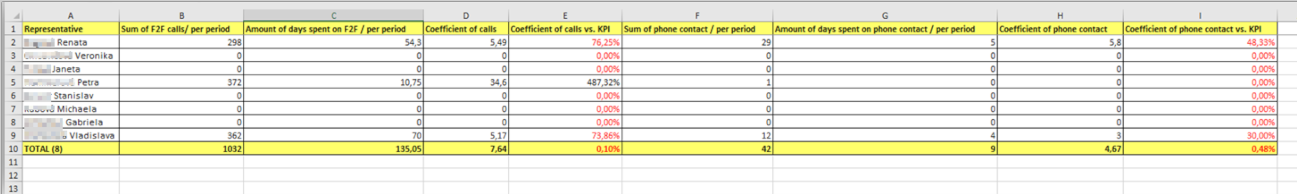
If all settings are correctly assigned, the report will be generated and look like this:
Data view
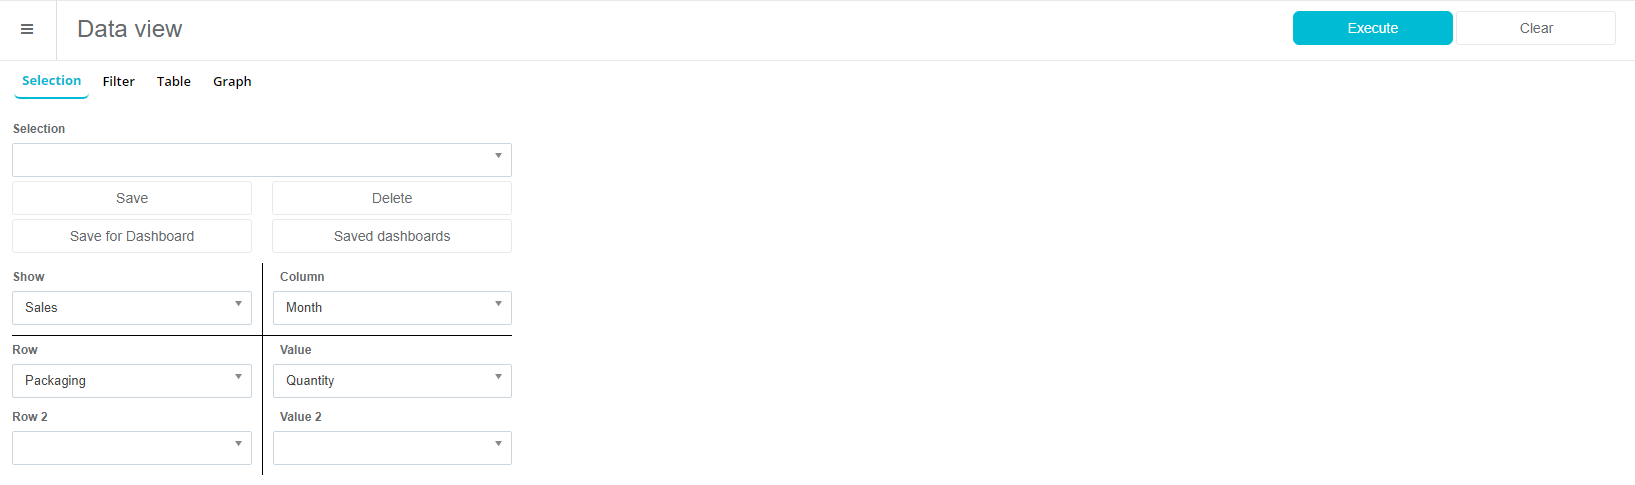
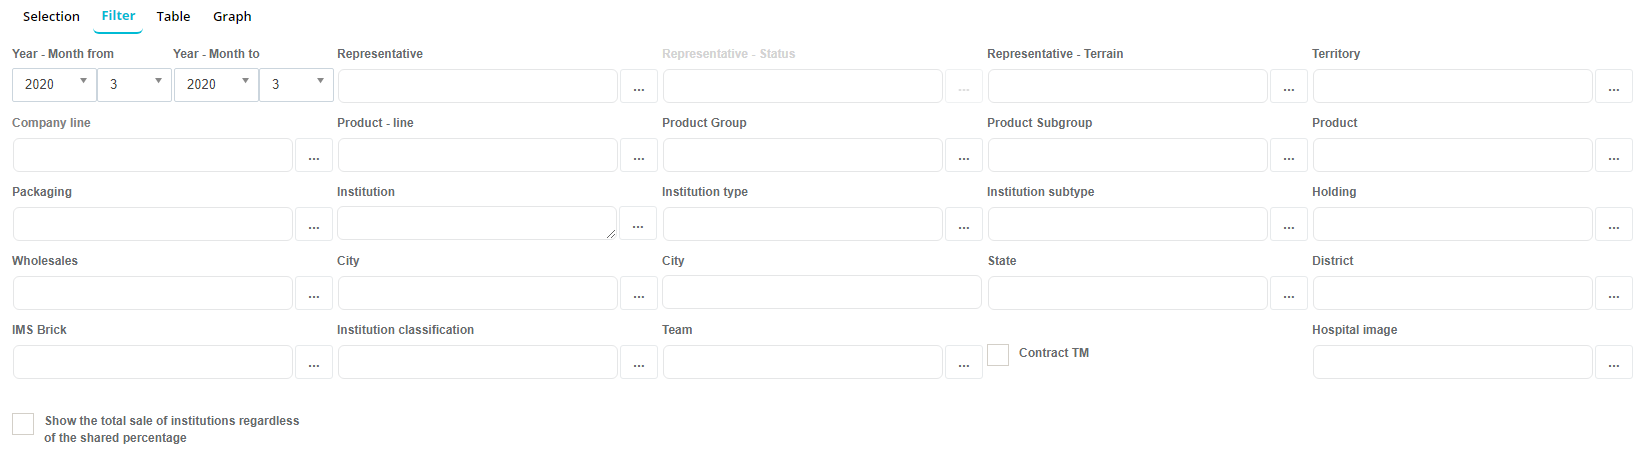
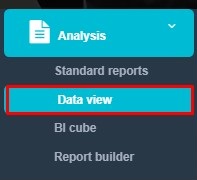
Data overview - Data view is a sub - module of analysis module where you can make quick ad hoc analysis. To select Data view place the mouse pointer on Analysis and under sub - menu choose Data view. Press on the Data View tab on the analysis menu and new window will appear. This is how the Data view analysis looks like once you open the module.
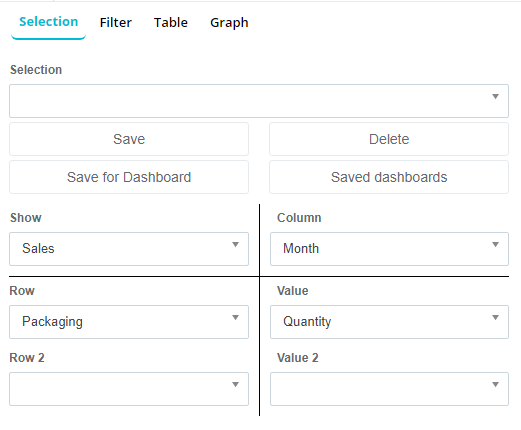
On the left side of the screen there are different parameters for creating analysis. You have columns with different filter options (Contacts, Sales, Visits, IMS sales, Month, Product and more) and time period for which you want to see the data from/to. Then you can define what kind of information you would like to see in columns and rows and you can set different criteria in the filters in order to expand or narrow down your report. Once you have entered all the parameters, click on Perform filtering to see the report.
There are a lot of other different filters which you can use to expand or narrow down your search.
For instance, you can select among a list of institution types statistics for some institution types by using a filter:
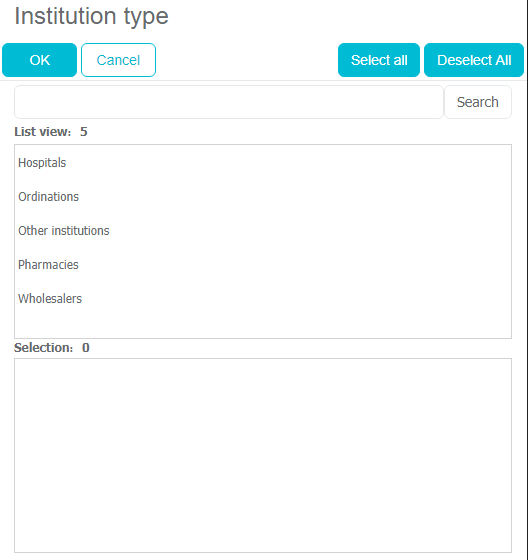
To see the information in the report you have to click on the Perform filtering button.
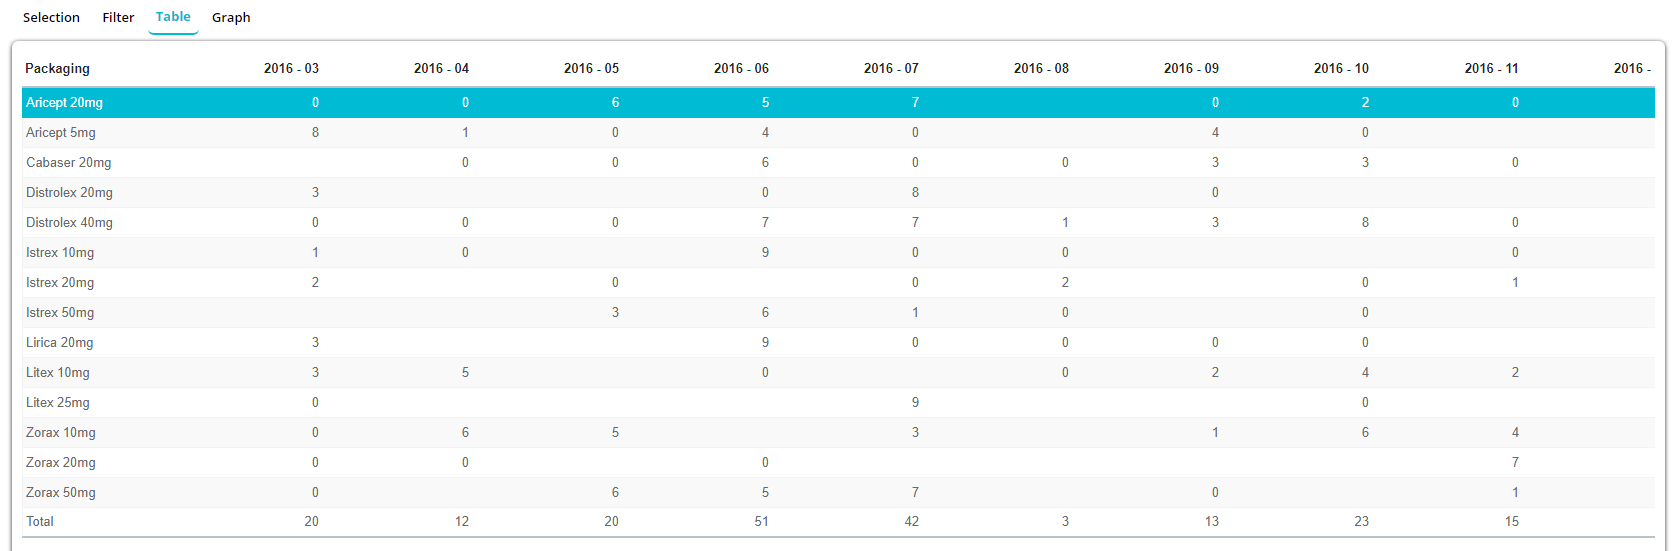
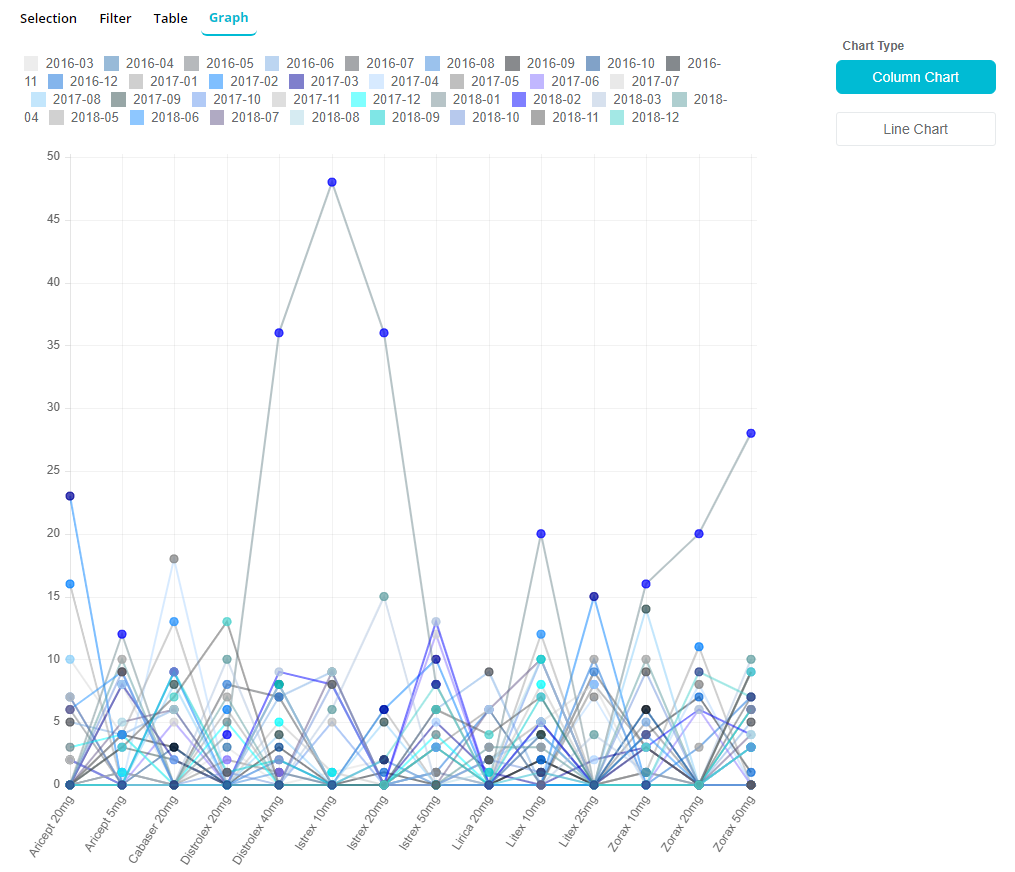
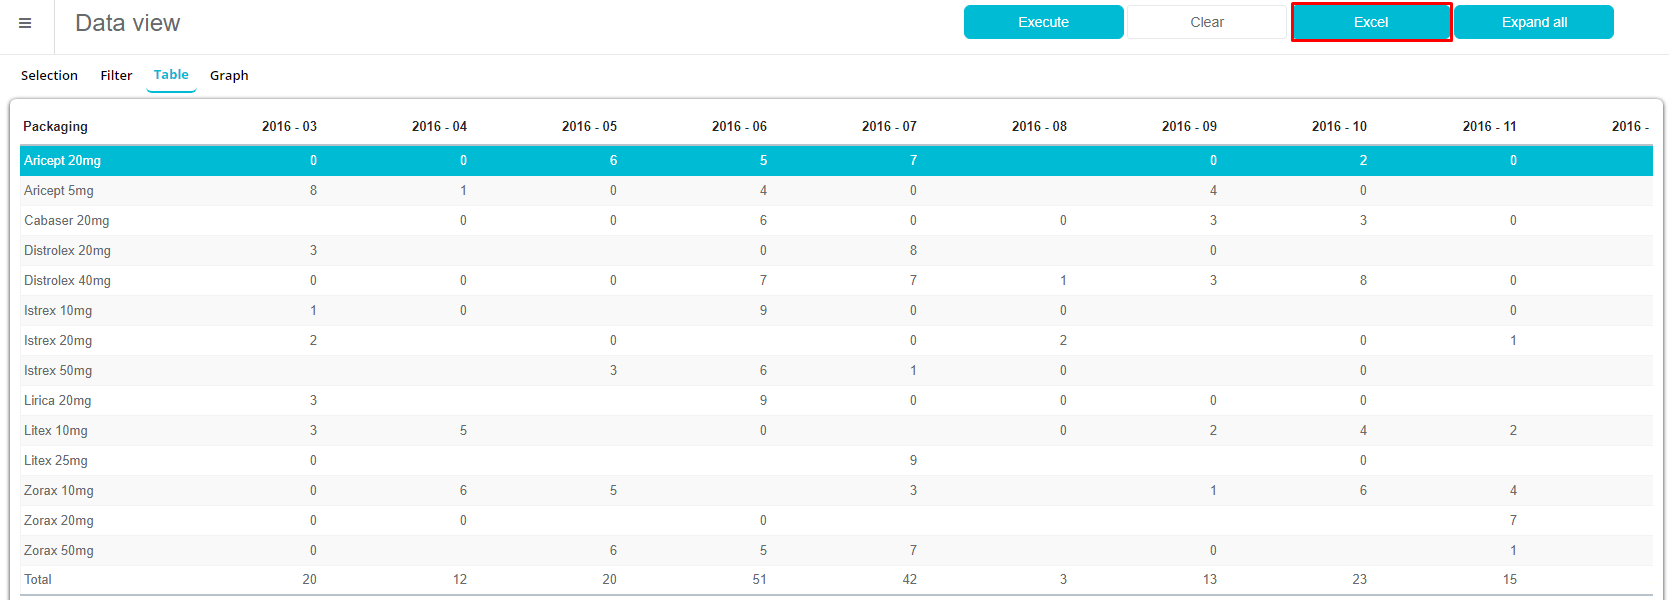
There is also a possibility to see the data in Table view, and in Graph view. If you click on the button Graph, you can see the exact data, but in graphical presentation.
Also current analysis can be printed or exported to MS Excel. Just press on Excel button.
Every analysis you create you can also save as a draft, and use it afterwards. Under selection you can find the saved drafts and just select it. To save the Analysis as a draft, click on Save button.

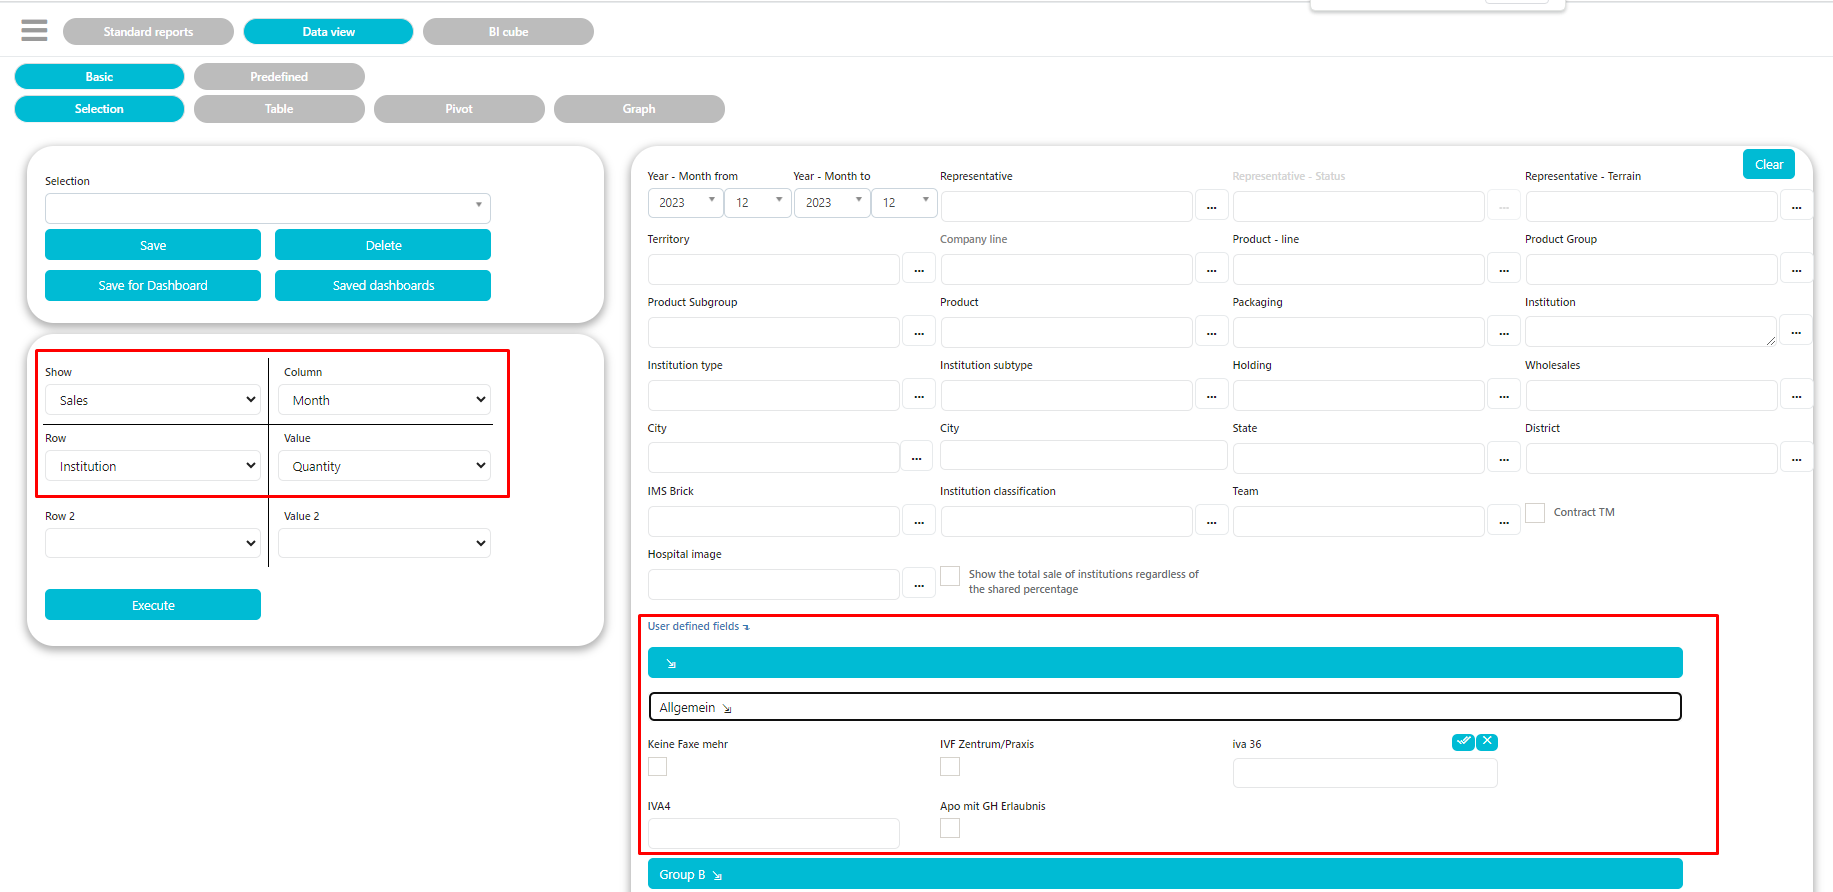
User defined fields in Data View
If you wish to view sales for institutions in Data View, then you can also filter by user-defined fields in filtering conditions.
Report server
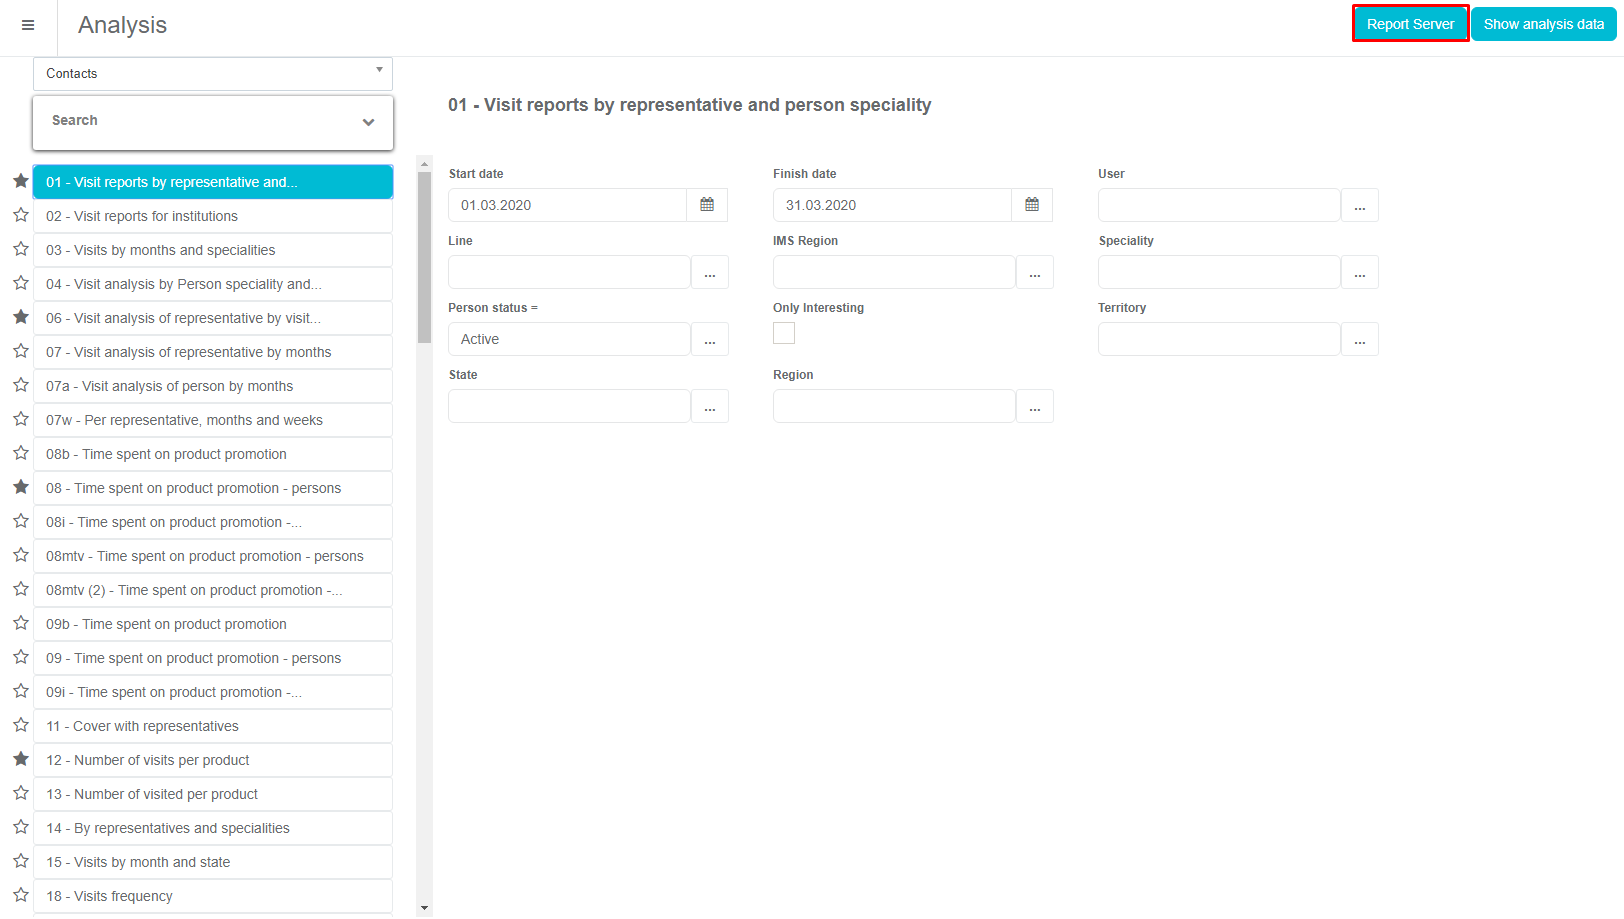
Report server is an analysis module that saves you time, and makes the life of any Sales representative a lot easier. With report server you can set up that any report can be sent to the sales representative's e-mail automatically at the desired date/time. First select the report you wish to send, and then set up the parameters. After that press on Report Server (see the picture below).
A new window will open, where you can set up different parameters. First you need to choose to which SR you want to send reports. Press on "..." to select the SR. Here you need to choose the SR to whom you wish to send a report. Find it, select it and press OK. Once you have selected the SR, next thing you need to do is to set up the time when the report is going to be sent. You can schedule time daily, by any day of the week, by particular date in month.
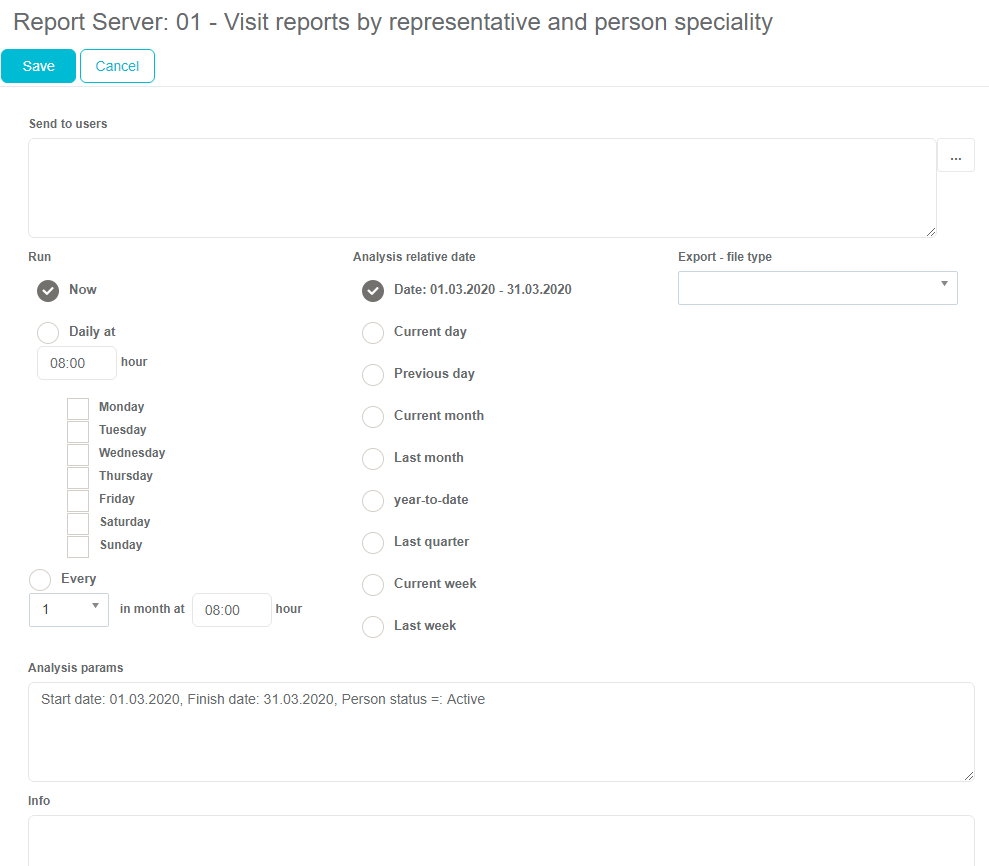
Once you are finished defining the time when the report is going to be sent, next thing is to set up the range for the data. This can be done on the right side (shown in the picture below). Report can use the data for a range of dates, from current month, last month, year-to-date, last quarter, last week. After you have entered all the data, to confirm the parameters click on the Save button.
Report generator
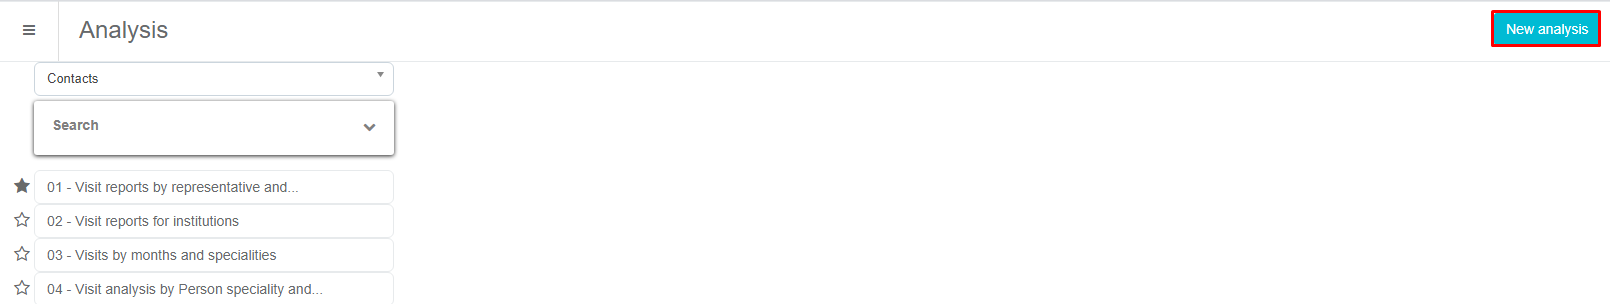
We use the report generator to create the analysis according to your own wishes and needs. To use this option, select Analysis from the menu, then select Standard reports from the submenu. In the Analysis categories drop-down menu, select the Contacts category.
After selecting a category, a New analysis button will appear on the right side of the window. After clicking on this button a new window for creating an analysis will open.
On the picture below you can see how the initial window for creating an analysis looks like. It consists of two tabs - Default and Filters. In the following examples are descriptions of the fields under the Default tab.

The first step is to select the type of the analysis - Cross-tab or List view. The difference between those two analysis types is in the options of selected parameters and in the data display.
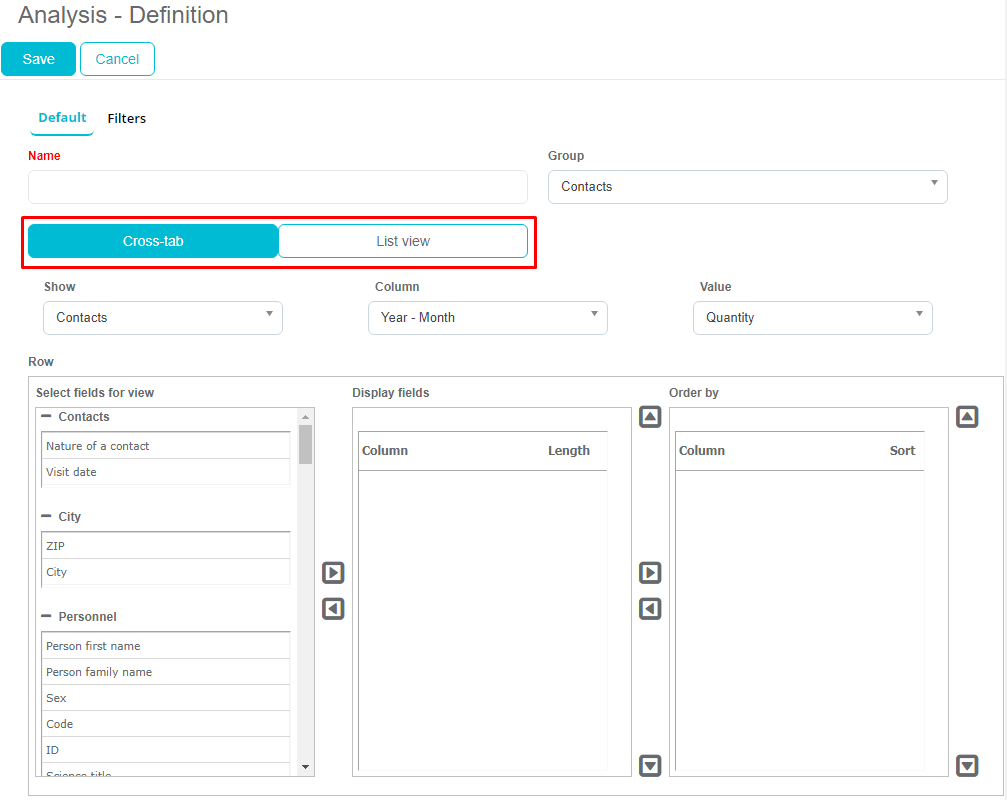
Cross-tab In the following examples is an explanation of all fields in the Cross-tab type of analysis.
Group - selection of an analysis group such as contacts, sales, persons etc. Show - selection of a view: contacts, group contacts or sales. Column - depending on the selection of the column, columns are generated. Eg. if the Year - Month column is selected, the result will be 2020 - 01, 2020 - 02, 2020 - 03, etc. Value - an aggregate value that is added up or summed up.
The following is an example of columns and values which can be selected when in field Show Contacts are selected.


In the Row section there are fixed Selected fields for view where the fields we want to display are selected. Depending on the selection in the Column drop-down menu, other columns will be generated and grouped under fixed fields depending on the value selected. By clicking on the "+" sign you expand the categories from which you choose the fields you want to display while clicking on the "-" sign you narrow them.
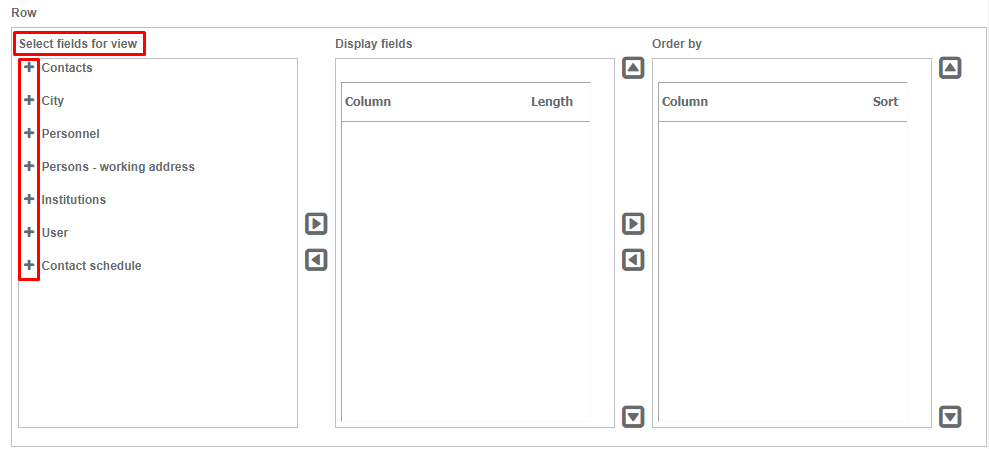
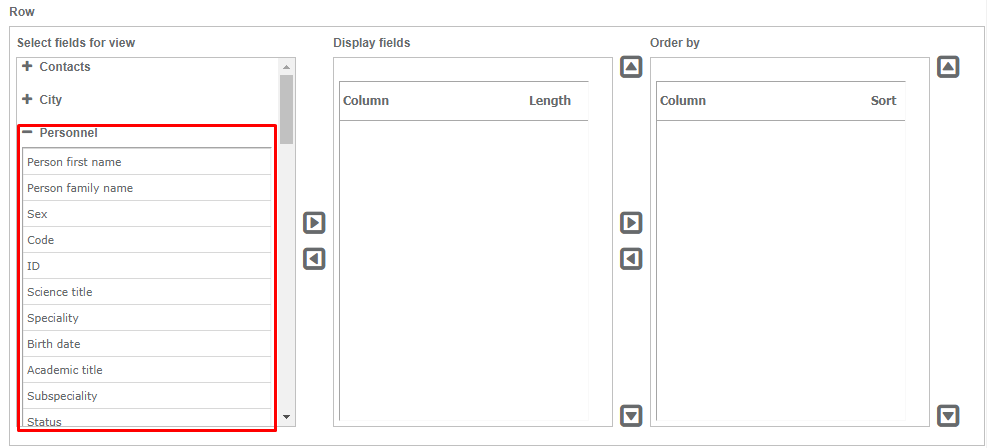
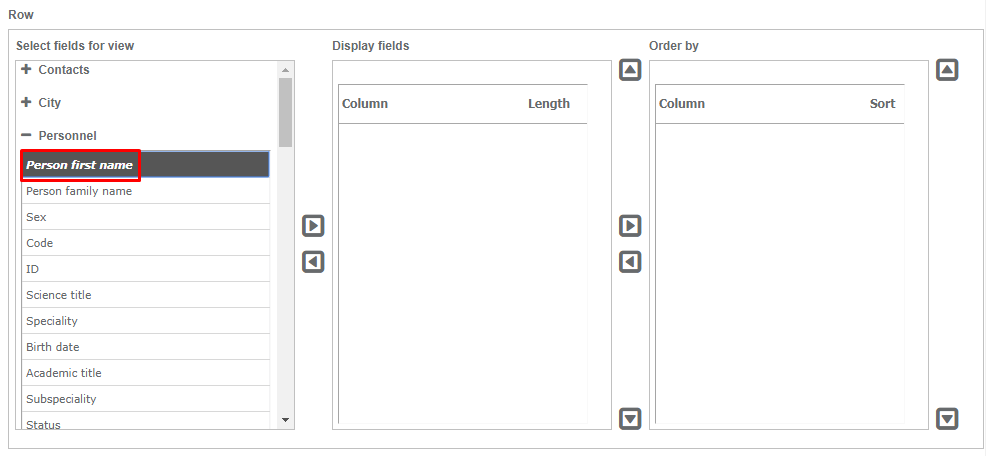
You choose the field by clicking on it.
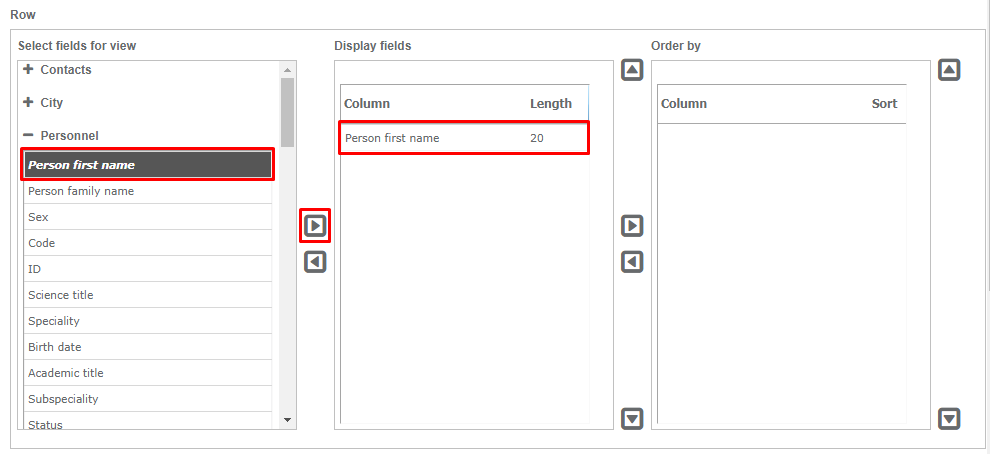
If we want to have a display of the selected field in the analysis, we need to transfer it to the Selected fields for view by clicking on the arrow pointing to the right (see the picture below).
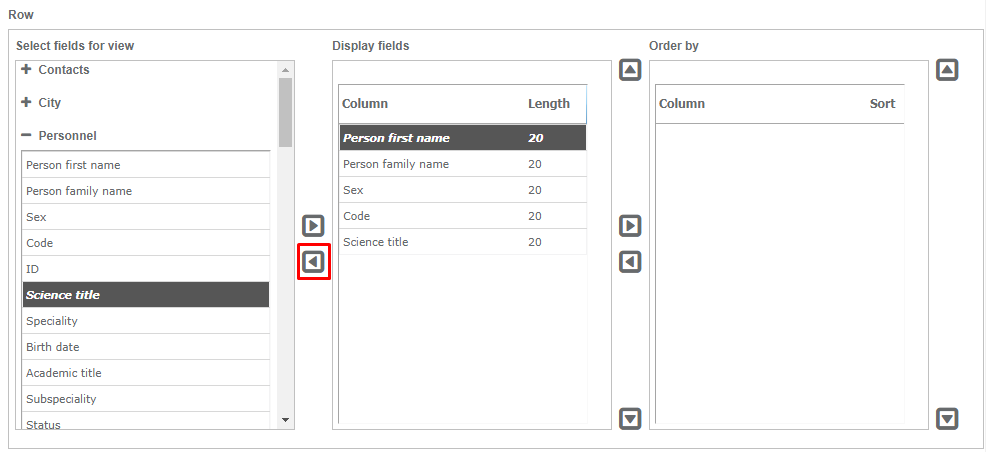
If we decide that we don't want to display the selected field, after selecting it, we click on the arrow pointing to the left. It's a procedure for returning the field to Selected fields for view (see the picture below).
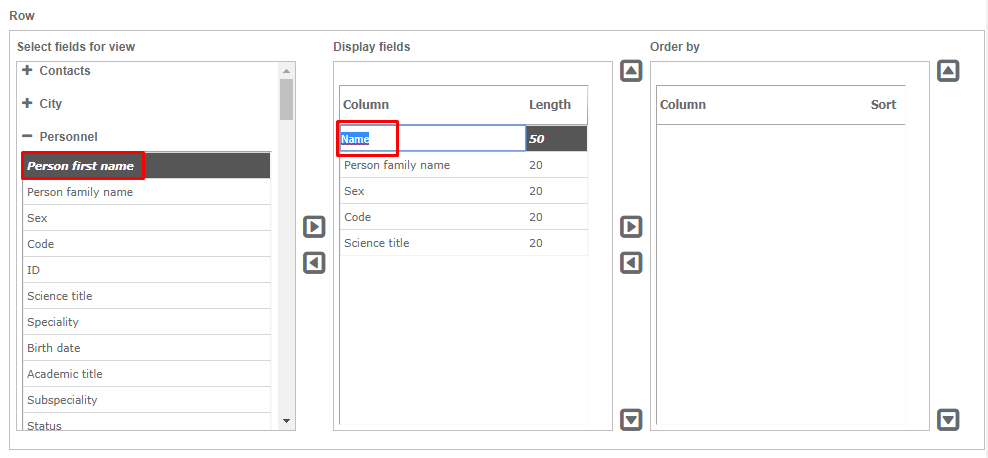
If we want to change the name of some column, we can do it by clicking on the current column name and then typing in the new name.
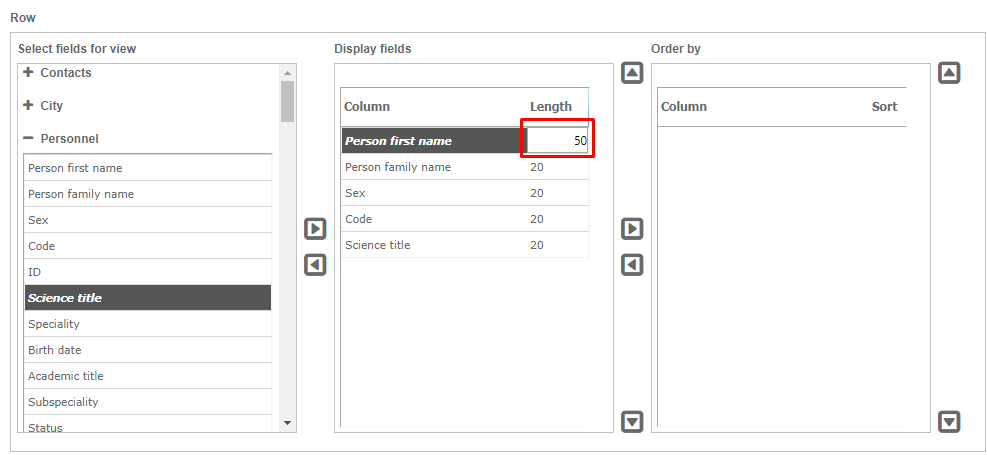
It is also possible to change the length of some fields. By positioning the cursor on the number we want to change and clicking on it, we can manually enter the desired length.
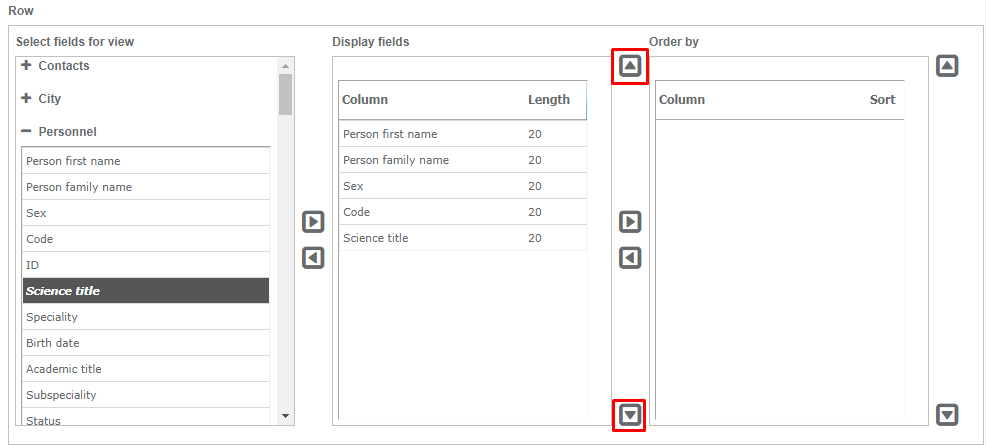
By selecting a column and using the arrows which are pointing up/down, we can move the position of the selected column.
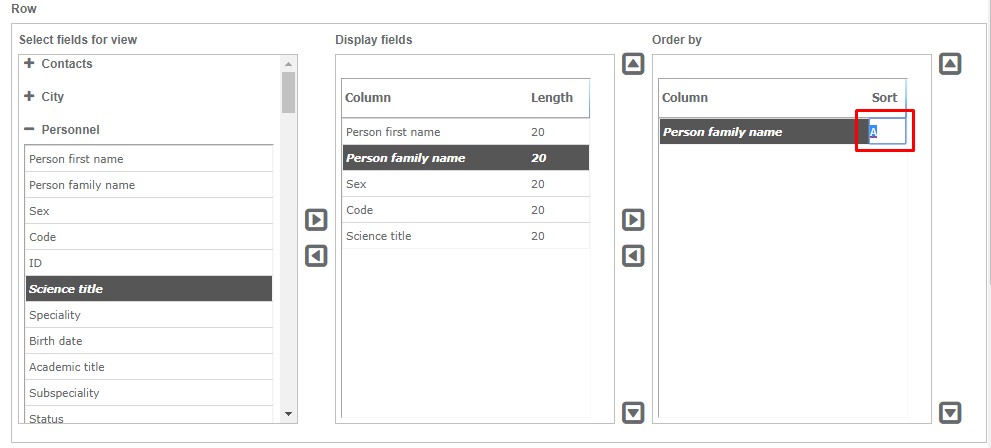
In the Select fields for view category, we select the column by which we want the data to be sorted. You need to click on the wanted column and click on the arrow pointing to the right to place it in the Order by category. If we don't want to use the selected column for sorting, we can remove it by selecting the column and clicking on the arrow which is pointing to the left. We can change the sorting order by clicking on arrows which are pointing up/down.
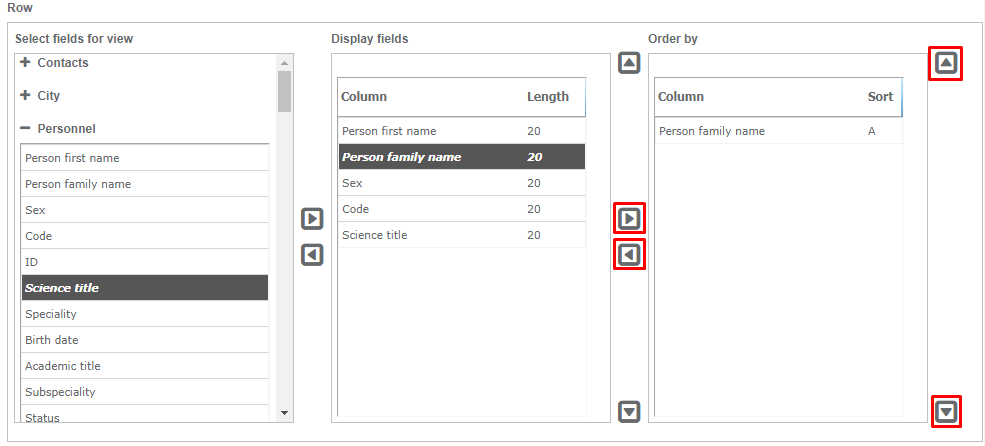
While sorting, it is also possible to change the sort by clicking on it. Eg. In the image below, a last name is selected for the sorting category. A stands for ascending, that is, the order in which A-Z results are displayed, however, we can change this to D which stands for descending, that is, the order in which Z-A results are displayed.
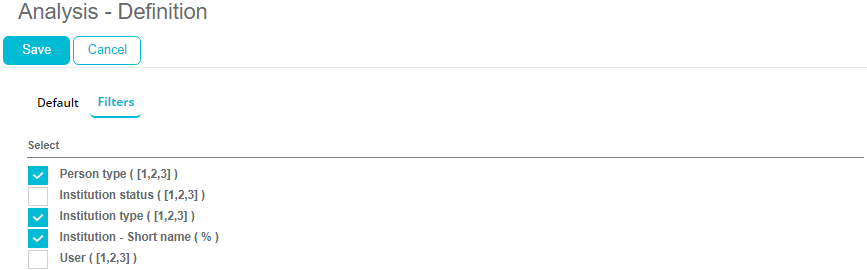
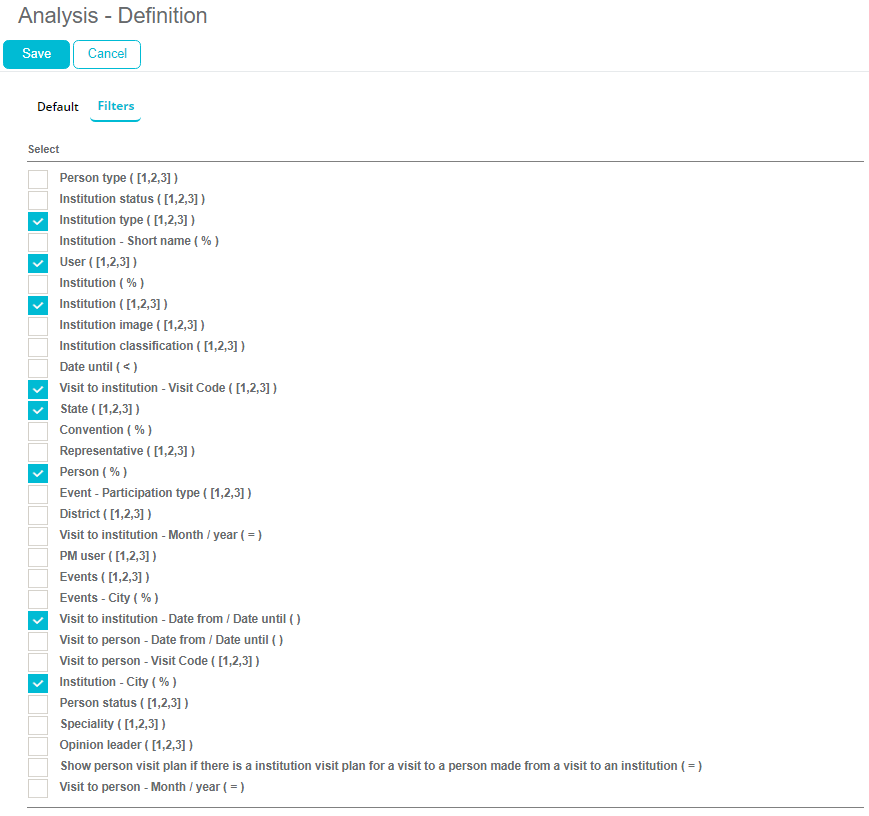
The second tab is Filters where we can choose from the filters we want to use while performing the analysis.
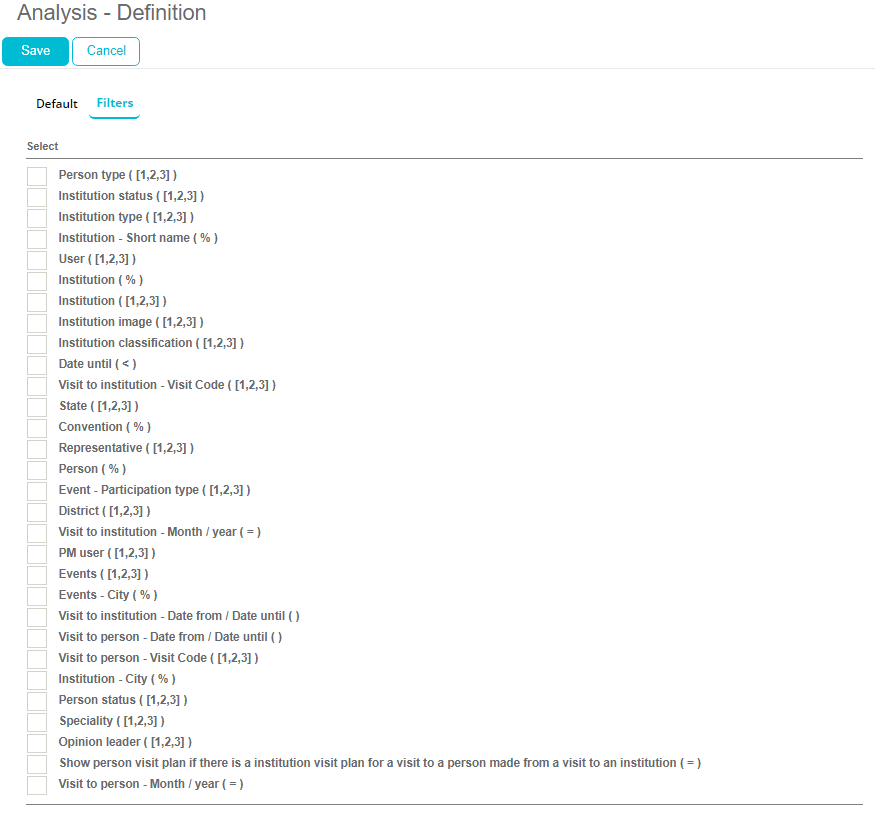
Filters are selected by checking the box next to the filter we want to choose.
Explanation of the symbols beside the filters: ([1, 2, 3]) - multiple choice
( % ) - search word (text field)
( < ) - values smaller than selected
( > ) - values greater than selected
( = ) - values which are equal to the selected one
( < > ) - values which are different than the selected one
(>, !=) - the value is greater, but not equal to the selected one
(<, !=) - the value is smaller, but not equal to the selected one
After selecting the wanted filters, we return to the Default tab. It is necessary to enter the name of the new analysis and store it by clicking the Save button.
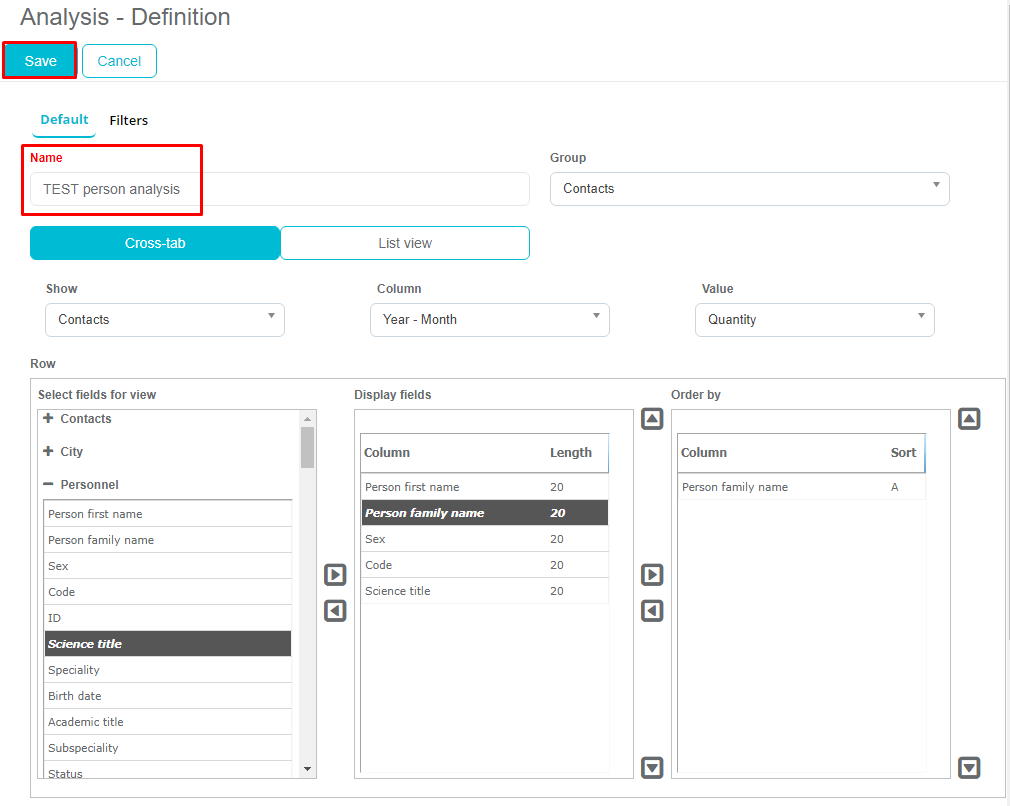
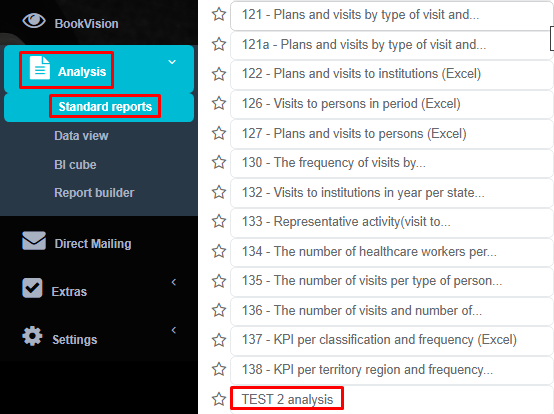
Our new analysis that we created will be at the bottom of the list, under the group we selected in the previous window.
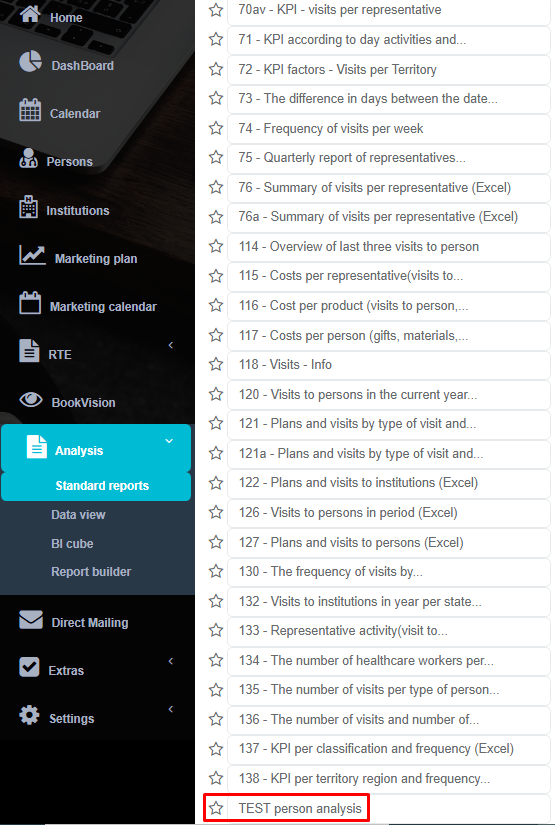
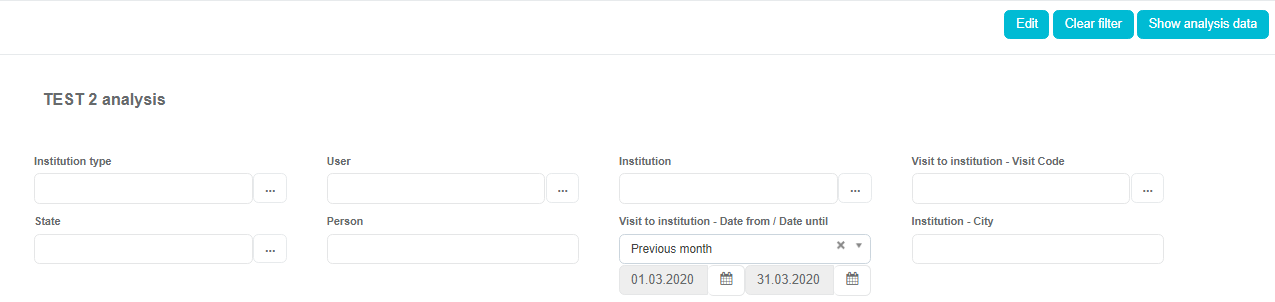
We select the analysis by clicking on it. Next you can see the filters we selected while creating the analysis.

We select the filtering parameters and click Show analysis data.

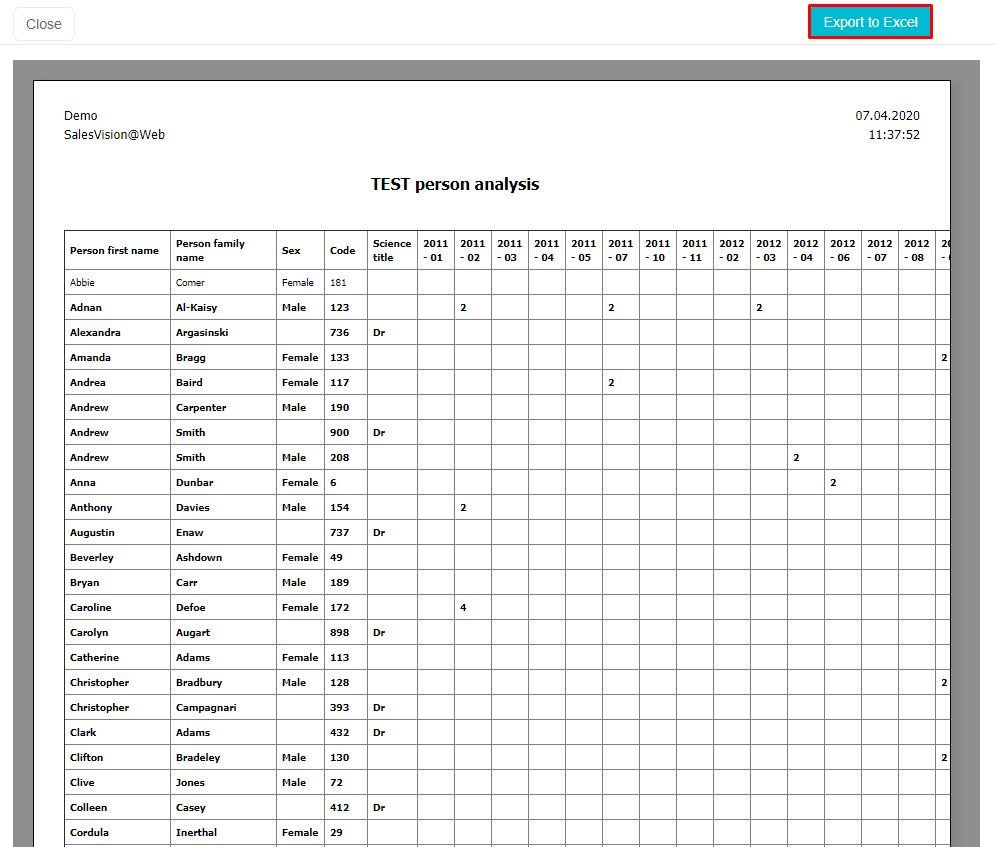
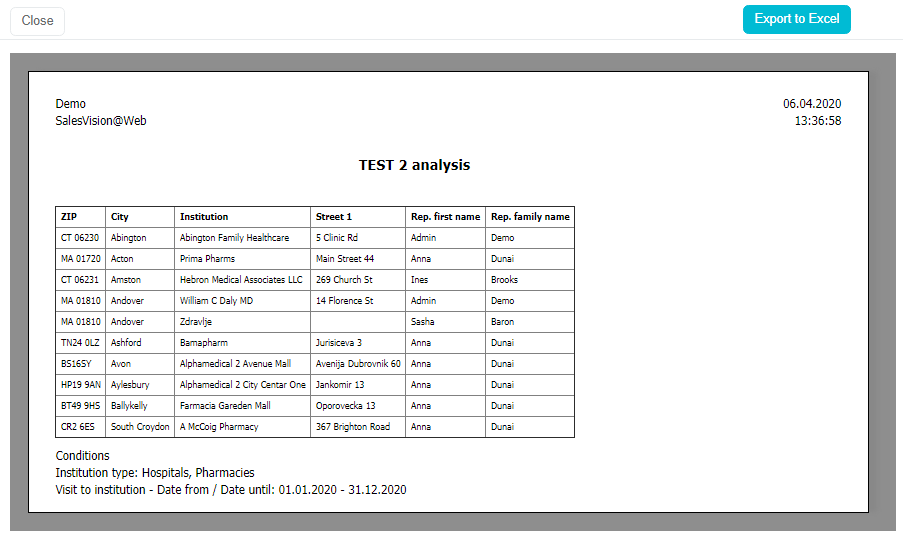
Below is the result of the analysis that we can export to Excel by clicking on the Export to Excel button.
If you want to see the results according to other parameters, click on Clear filter button and select other parameters.
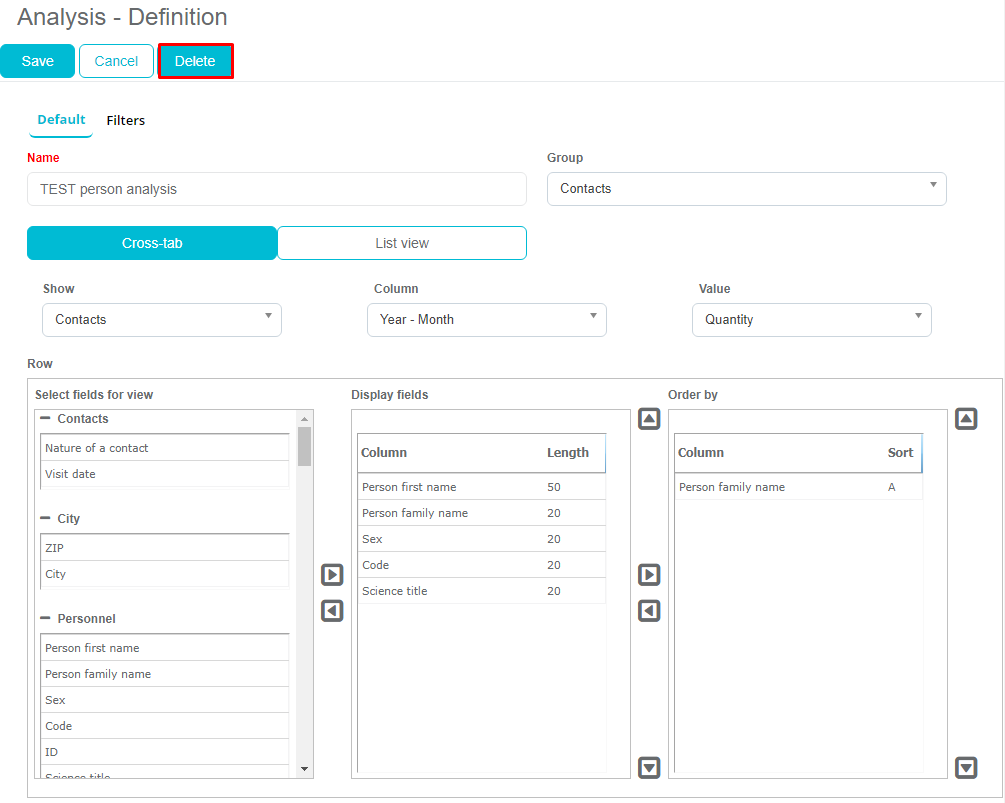
To change the analysis (add or remove fields, etc.), click on the Edit button.

By clicking on Edit we go back to the window where we define the analysis. To delete the complete analysis, click the Delete button.
After clicking on the Delete button a window with following message will appear:

If you want to delete the analysis, confirm by clicking the OK button. If you don't want to delete it, click on the Cancel button.
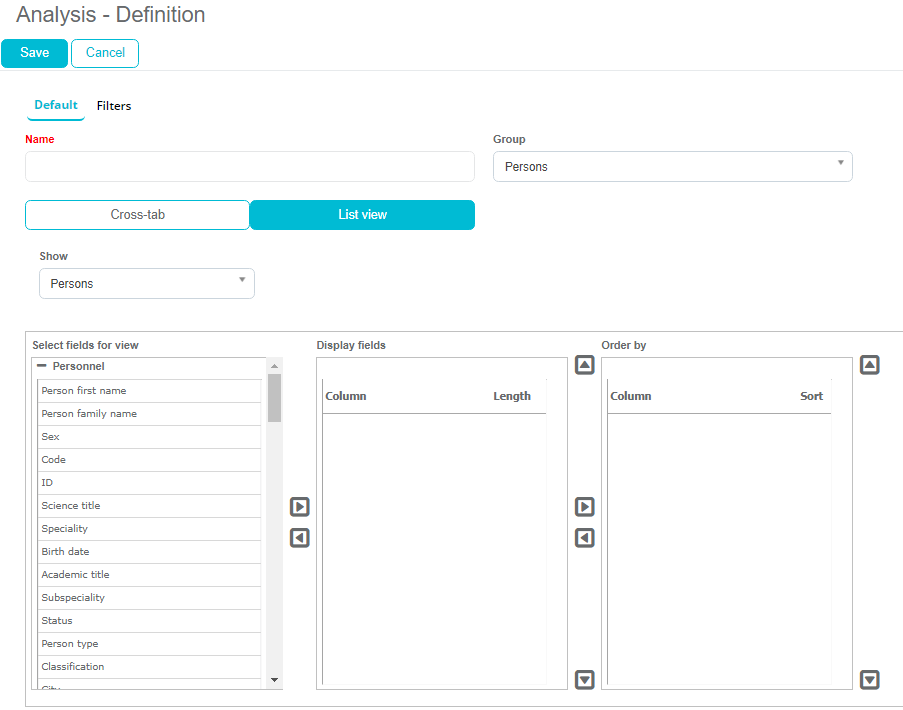
List view
In the following examples is an explanation of all fields in the List view type of analysis.
Group - selection of an analysis group such as contacts, sales, persons etc.
Show - selection of a view: persons, institutions, contacts, group contacts, sales and events.
The process of selecting fields/columns and modifying them is the same as for the Cross-tab analysis.
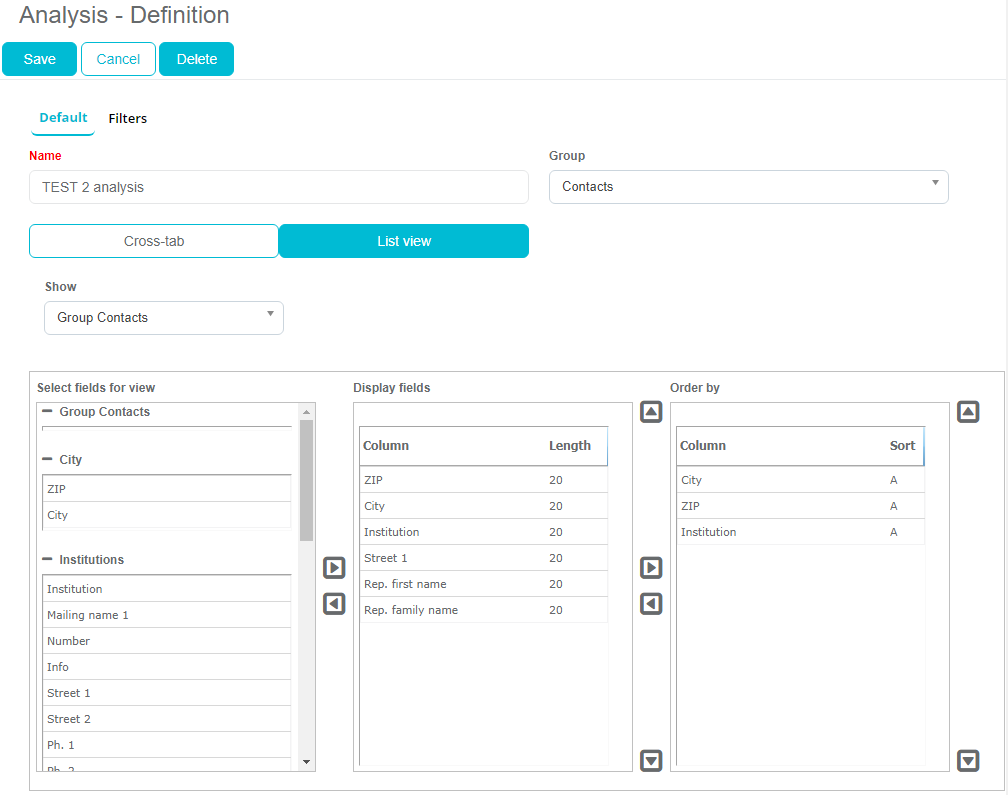
After selecting and arranging the fields, it is necessary to enter the name of the analysis and select filters in the second tab.
After saving the analysis, you can find it at the bottom of the list, under the group you selected in the previous window (in this example, the Contacts group).
We can see the filters we can select to perform the analysis.
The result of the analysis:
Important to know is that it is possible to create your own analysis only for Contacts, Group Contacts, Persons and Sales groups.
Data view KPI
KPI - Key Performance Indikator
Face 2 Face visit per day - persons
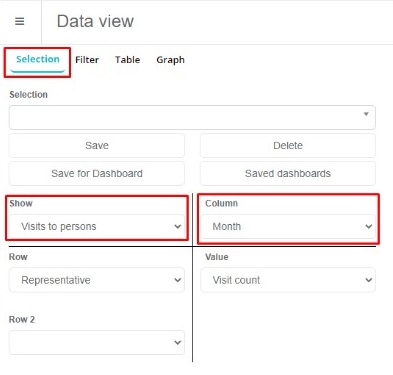
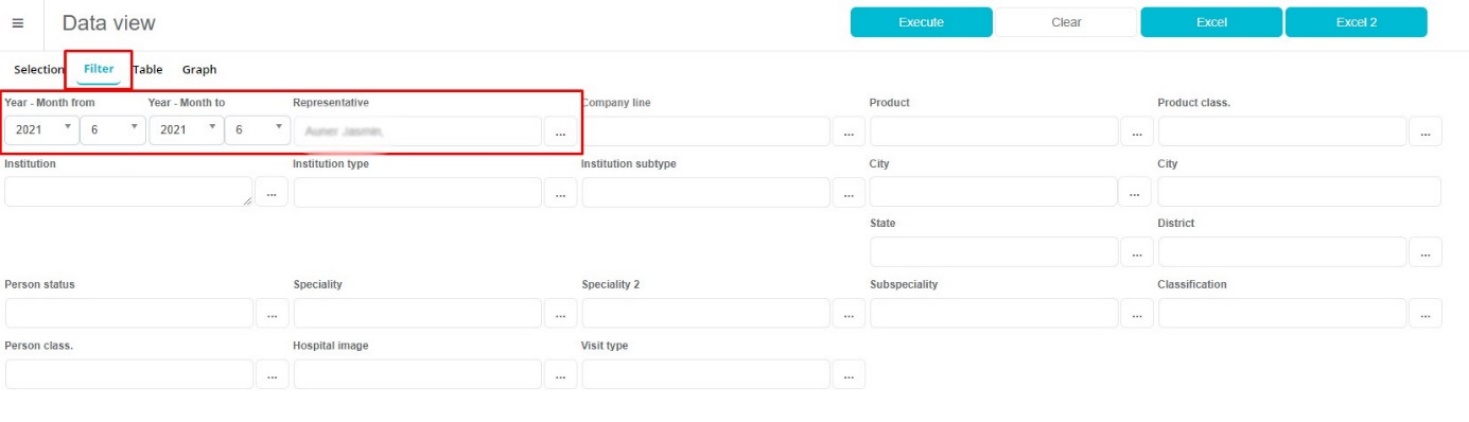
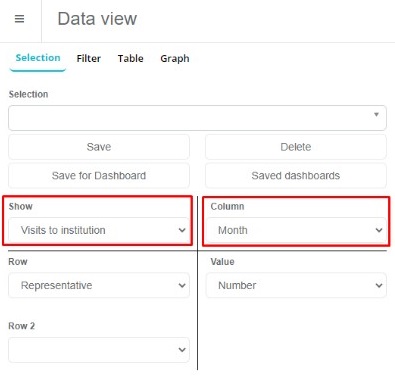
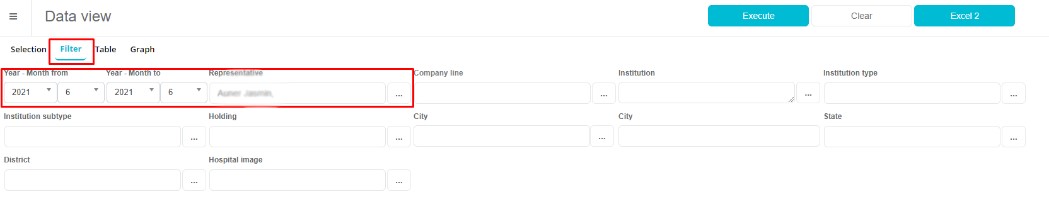
- SV Anywhere ->Analysis ->Data view ->Selection -> Show:Visits to persons, Column month 2.Filter: select desired time range for data view
- Representative: select desired sales rep
- Execute The number of all in option activities (Option 711 Face to face visit type in SV AnyAdmin) is summed.
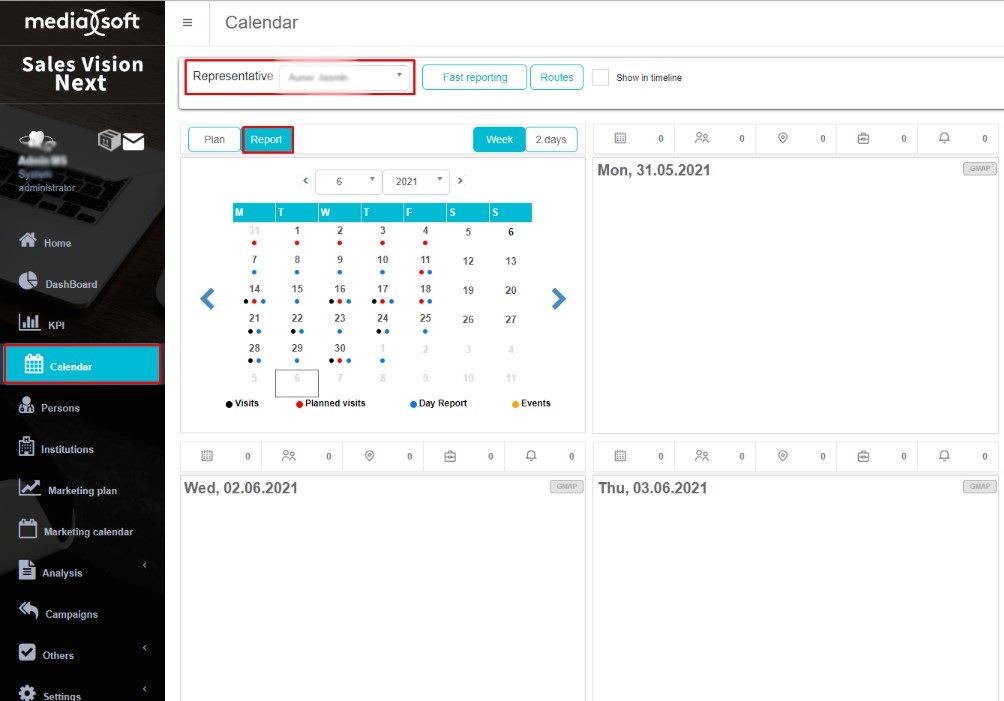
- Main menu -> Calendar: select representative, click on Report
- Day by day, sum all in option visit types to persons: the sum is the one represented in step 2 KPI calculation: Total accomplished visits classified as Face to face visits / Days in Field
Face 2 Face "visits per day" Institutions
- SV Anywhere -> Analysis -> Data view -> Selectio -> Show: Visits to institutions, Column: month
- Filter: select desired time range
- representative: select desired rep
- Execute The number of all in - option activities (program option 711 in SV AnyAdmin) is summed
- Main menu -> Calendar: Select representative, click on report
- Day by day, sum all in - option visit types to institutions: the sum is the one reprented in step 2.
- KPI: Select rep, and confirm by clicking on "Search". Total accomplished visits classified as Face to face visits / Days in Field.
AI Analysis
AI analysis is a powerful tool that can help administrators create reports that currently don't exist in the system. It is also possible to save those reports in your favourites for future use. It is located in the "Analysis" module under "AI analysis" tab.
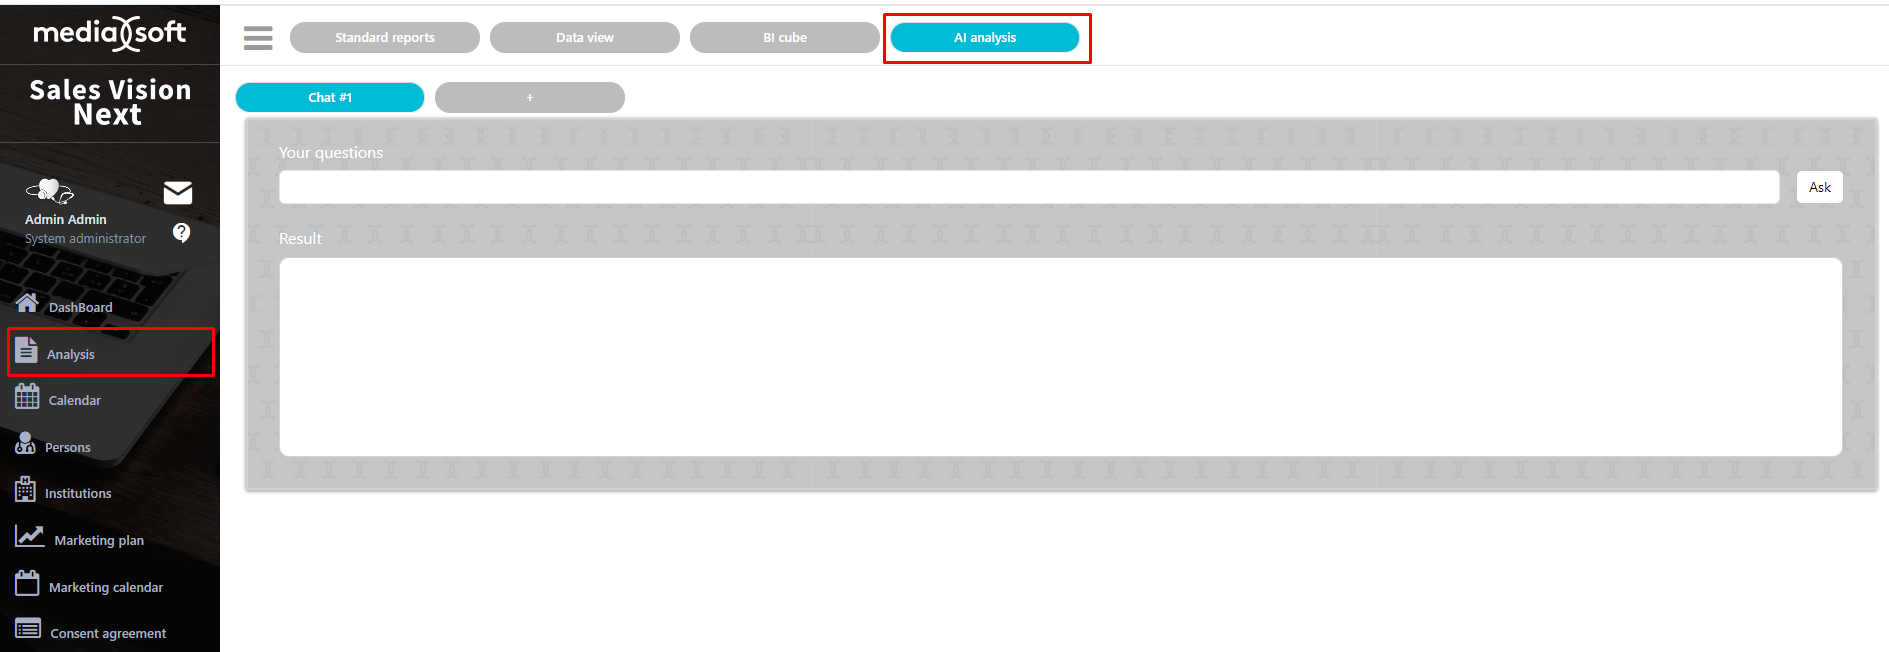
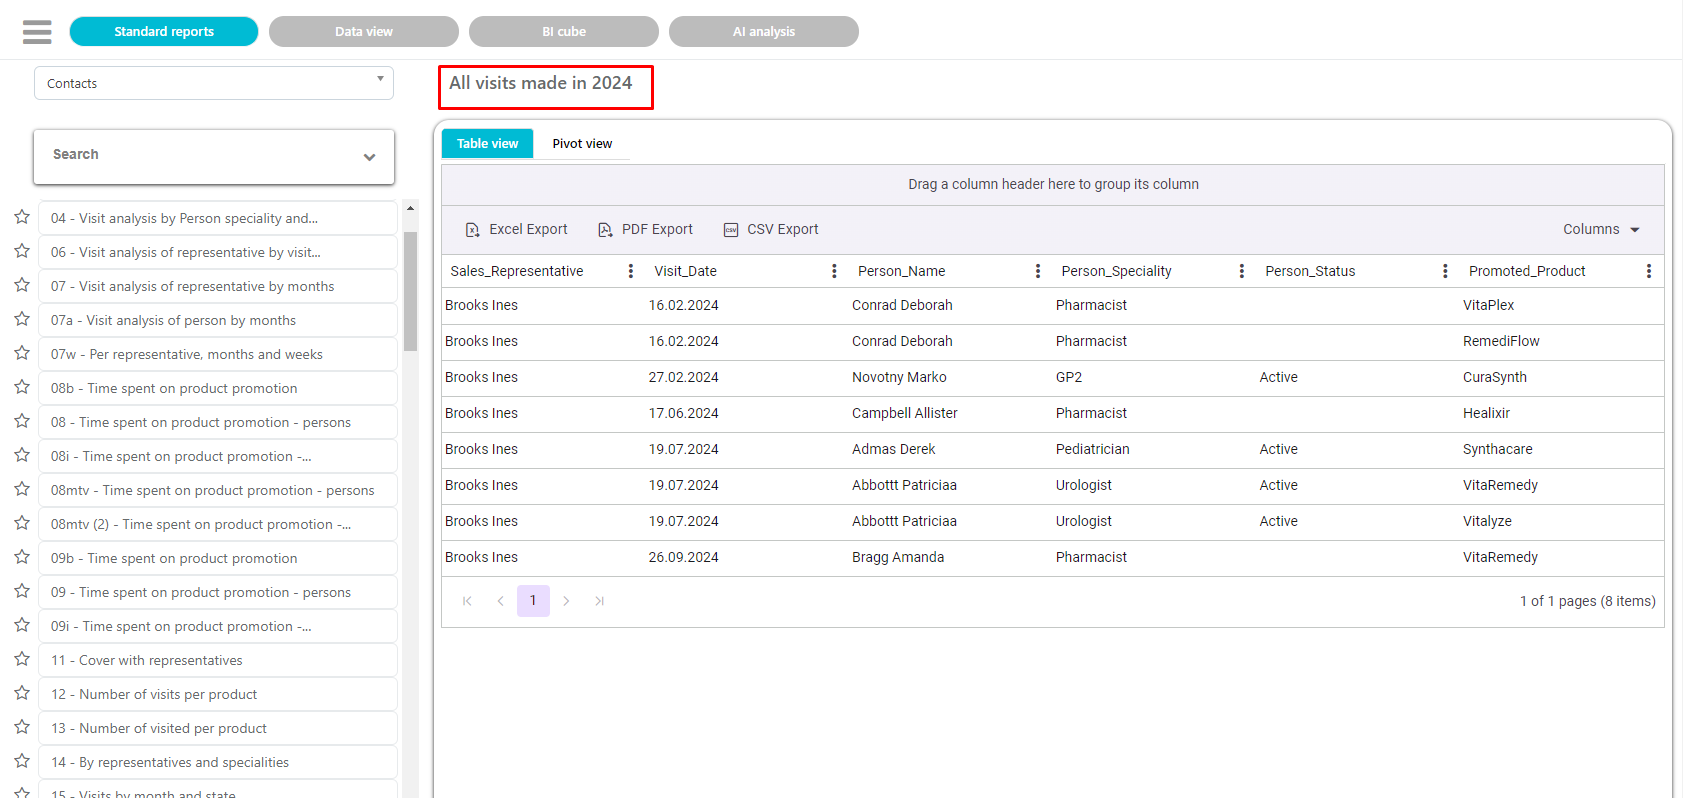
After asking AI Analysis a question, it generates a report based on the information we gave to it.
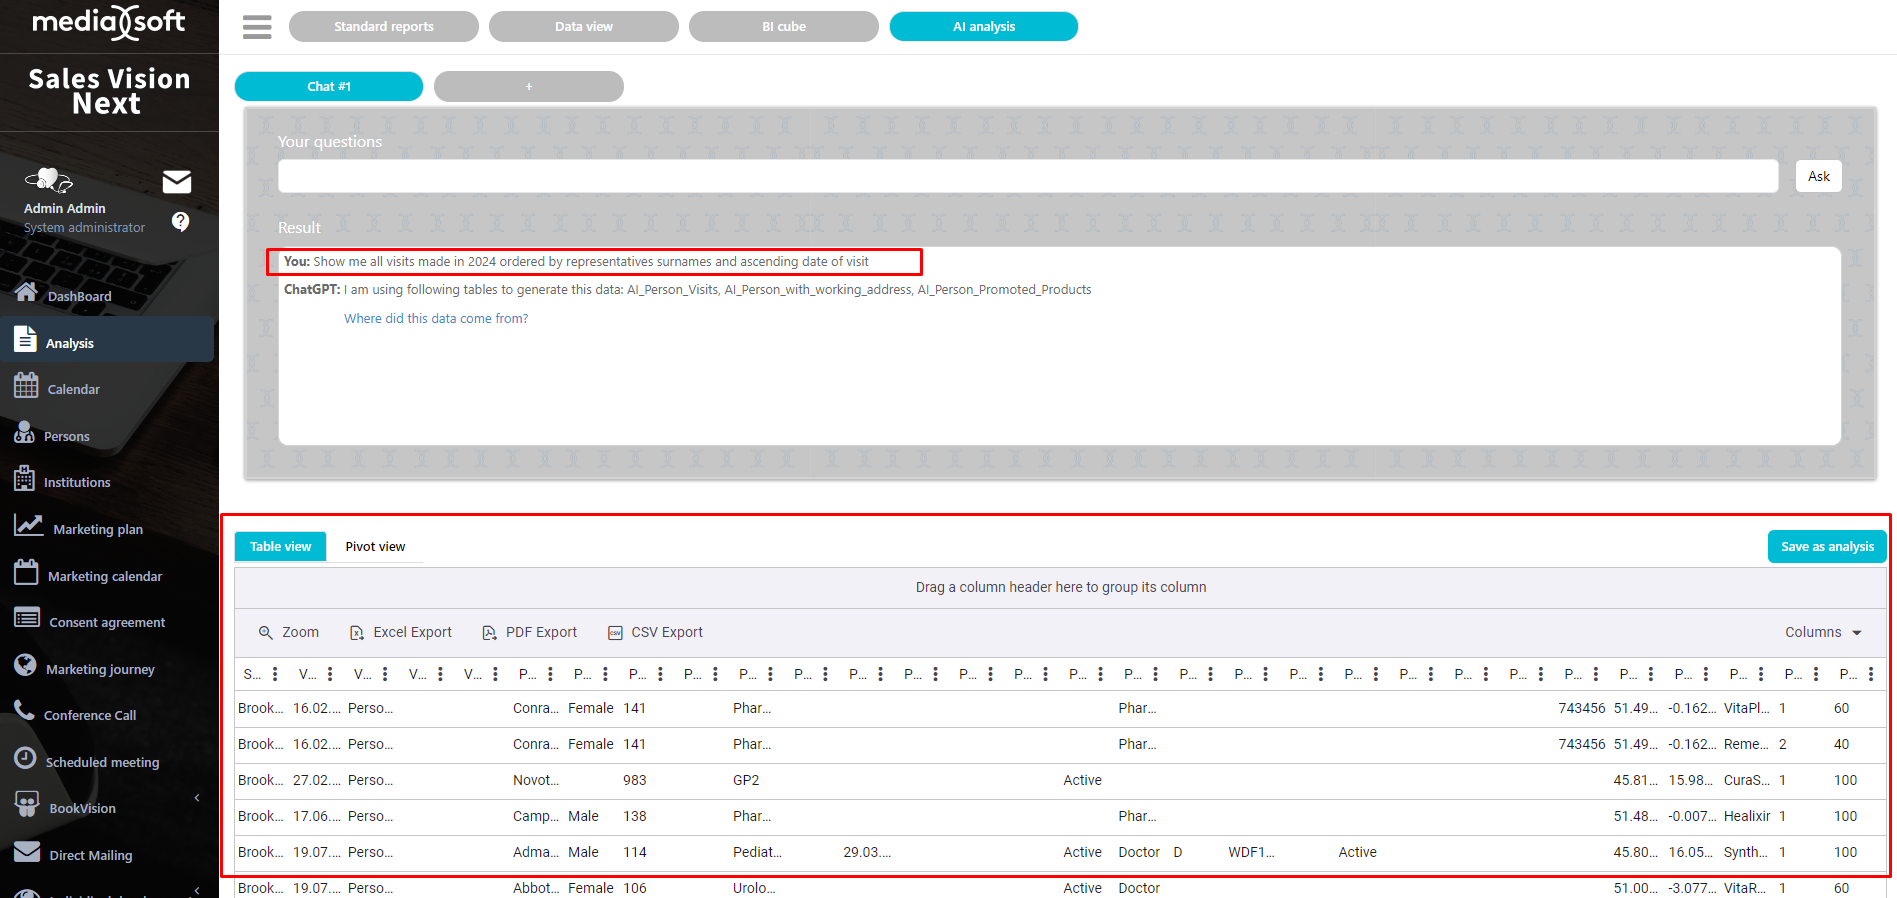
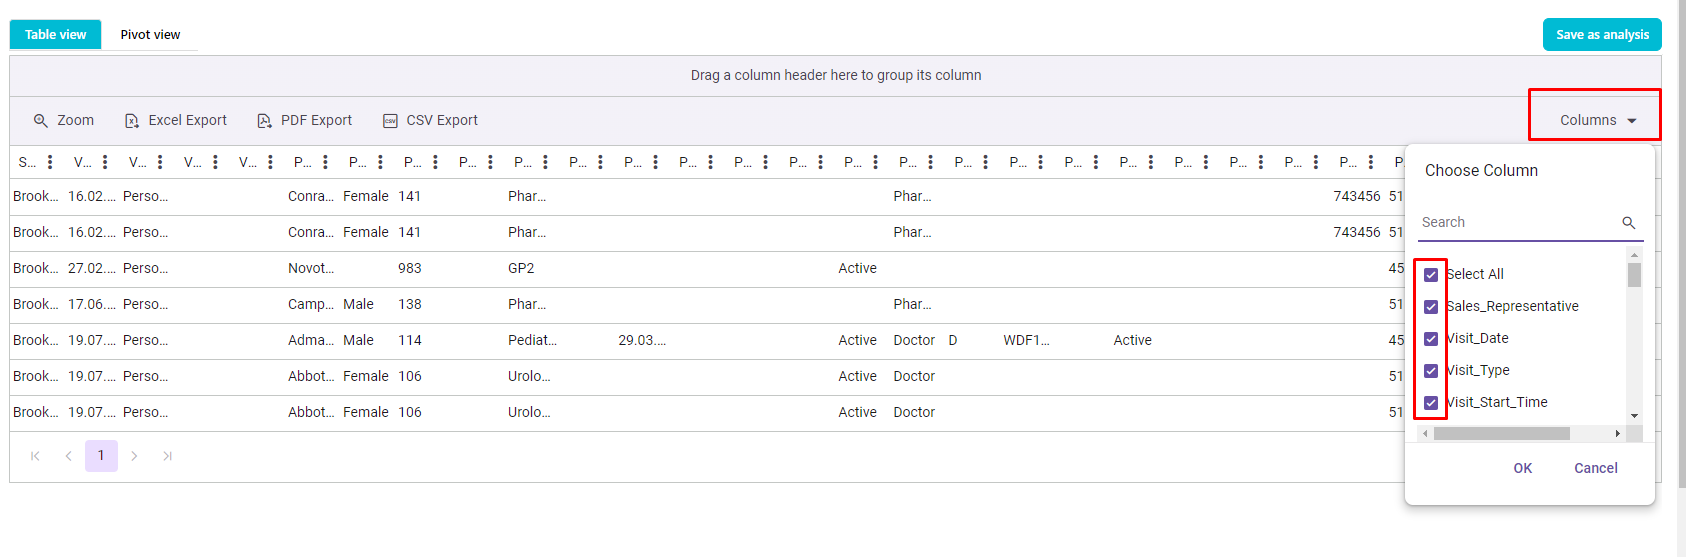
As we can see, the system gave us a lot of columns, maybe most of them aren't useful to us right now. We have 2 options: Option: Click on "Columns" button and uncheck columns we don't need/want to see.
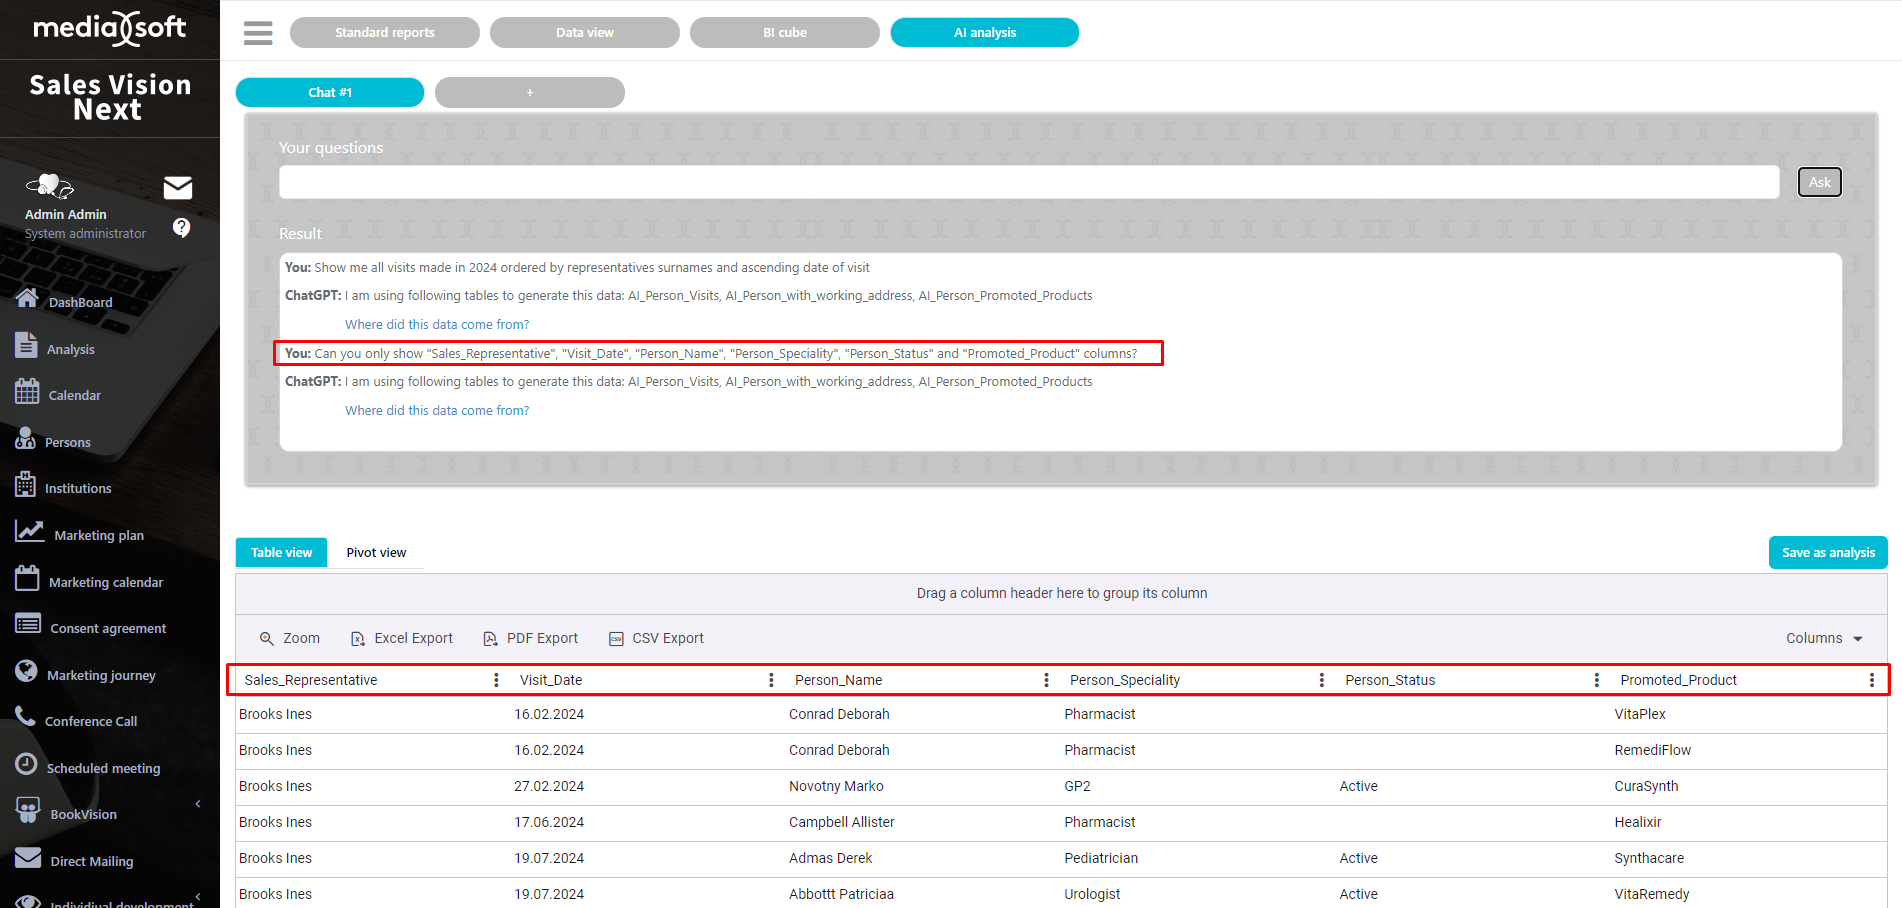
- Option: Directly ask the AI Analysis question again to modify the columns to our liking, such as: "Can you only show "Sales_Representative", "Visit_Date", "Person_Name", "Person_Speciality", "Person_Status" and "Promoted_Product" columns?"
It's also possible to Export to Excel, PDF Export and CSV export, and the system will then export exactly the way that the analysis looks like right now in the application.
If we would like to re-use this analysis, we can save it in one of the available groups by clicking on the "Save as analysis" button.
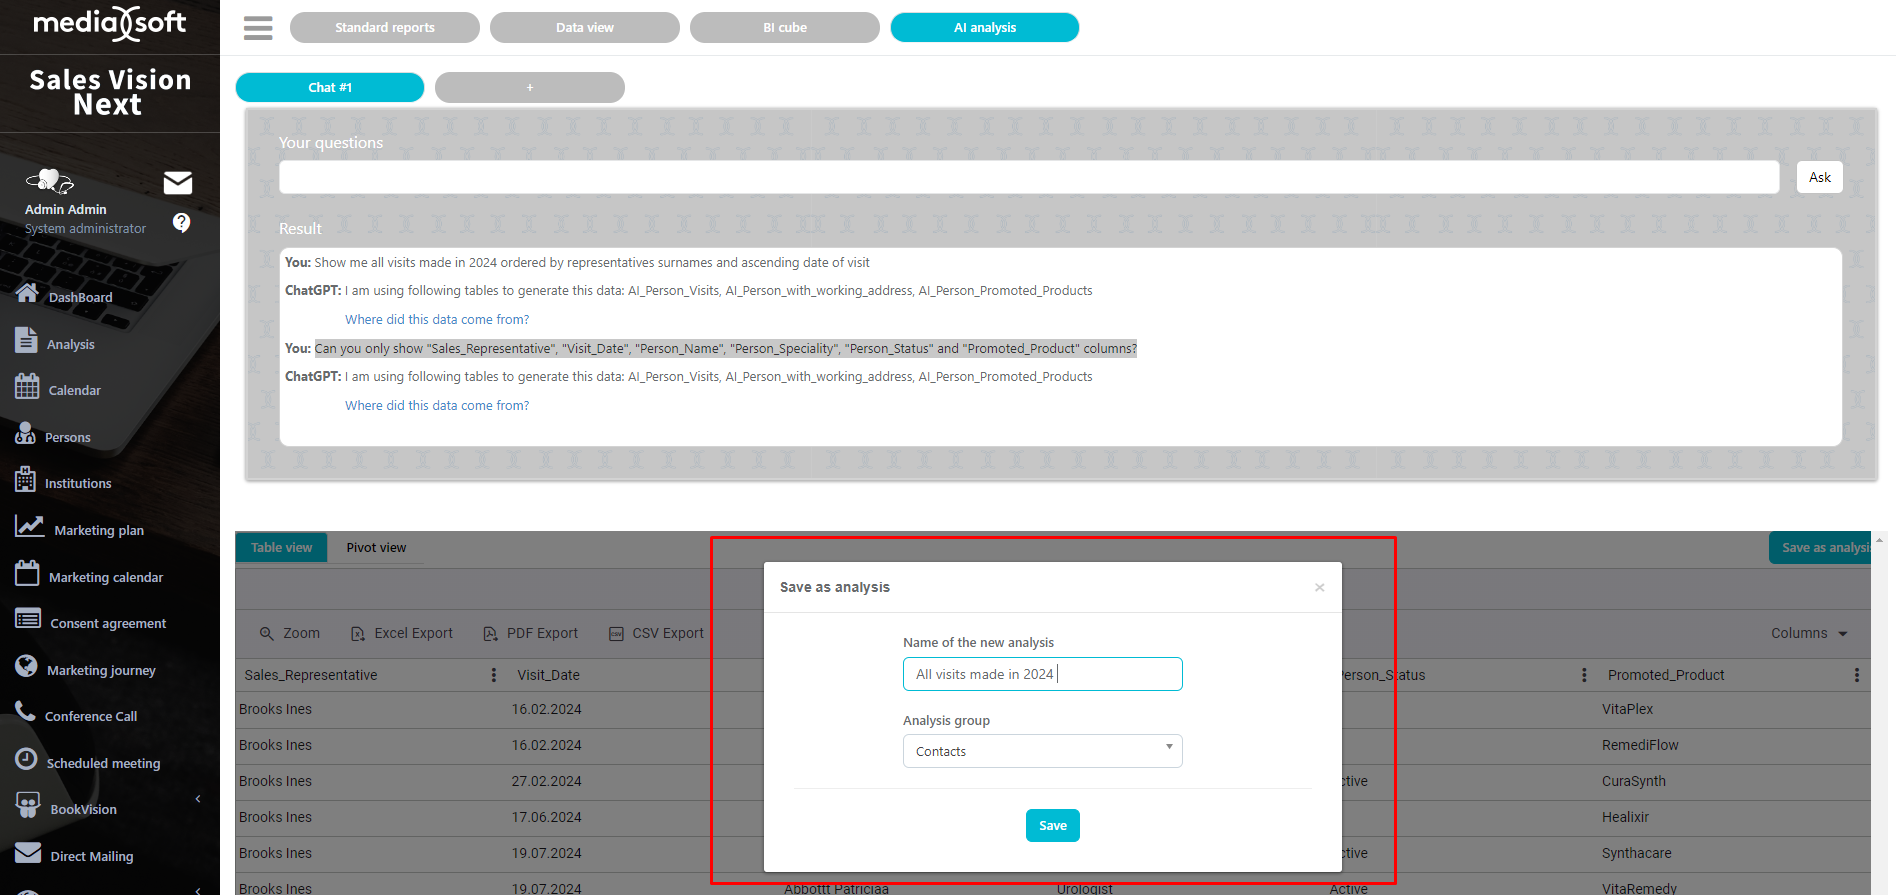
The analysis that we created can't be modified any longer, but it does show up-to-date information.