Sales Plan
Sales Plan module is located as a submenu in Others menu.,
It is available only for System Administrator and HQ users. Depending on the setup, the data source for plan could be Wholesalers sales or IMS sales imported in the Sales Vision database.
This module enables sales planning on a country and products level and drilled down to brick and packaging level.
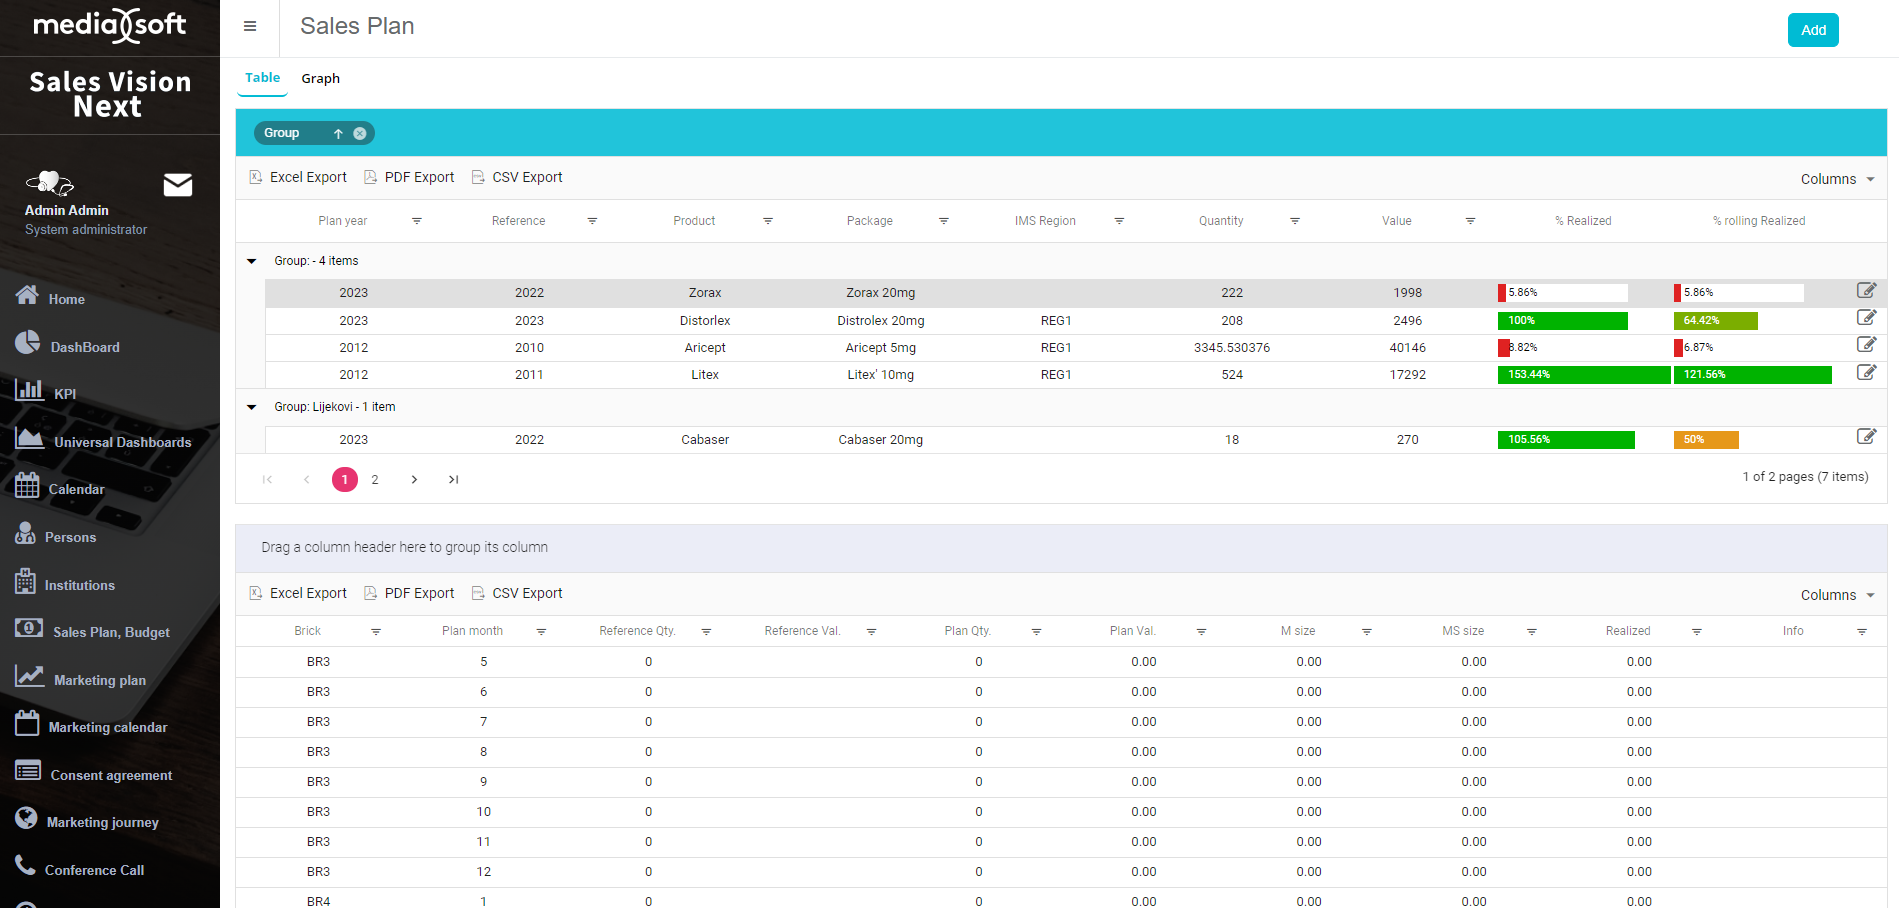
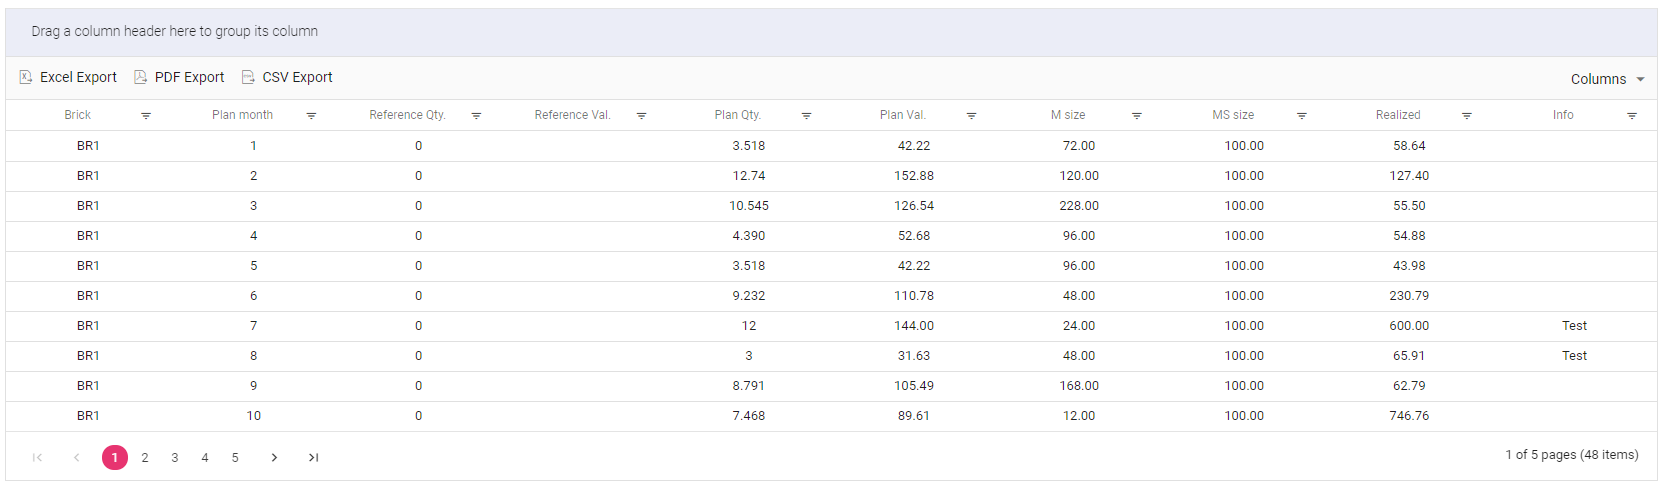
Sales Plan module offers two different layouts: Table and Graph. Table view is divided into several parts:
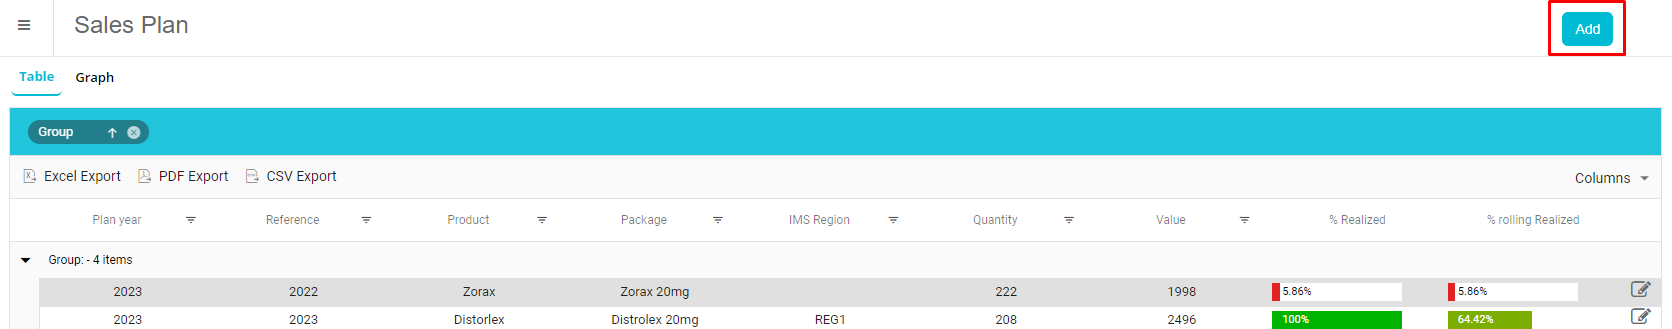
Add button in the upper right part to add a new definition of the sales plan
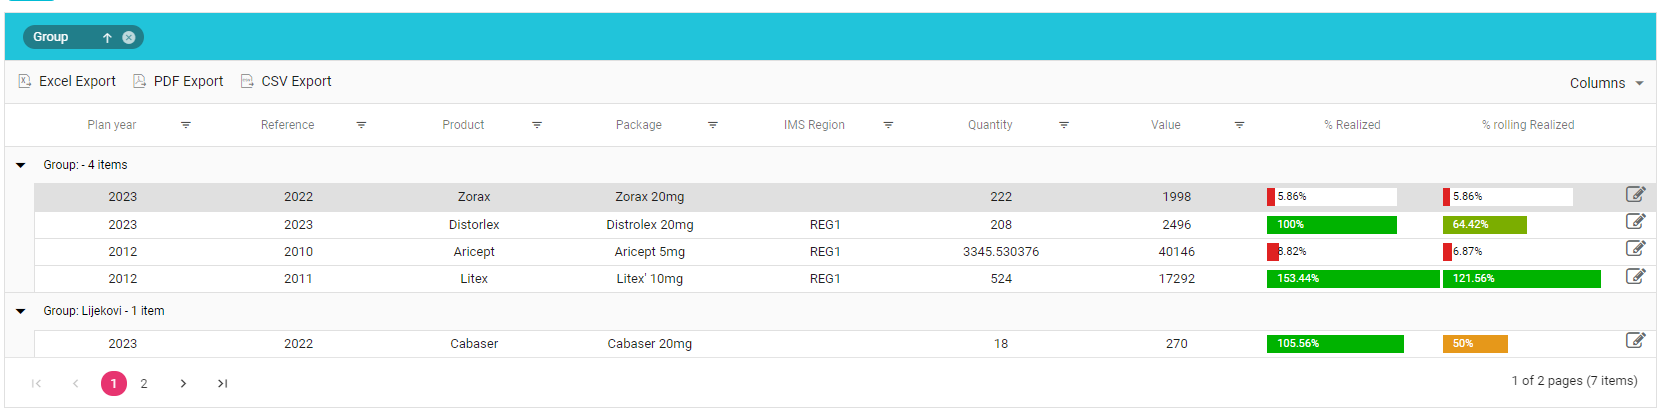
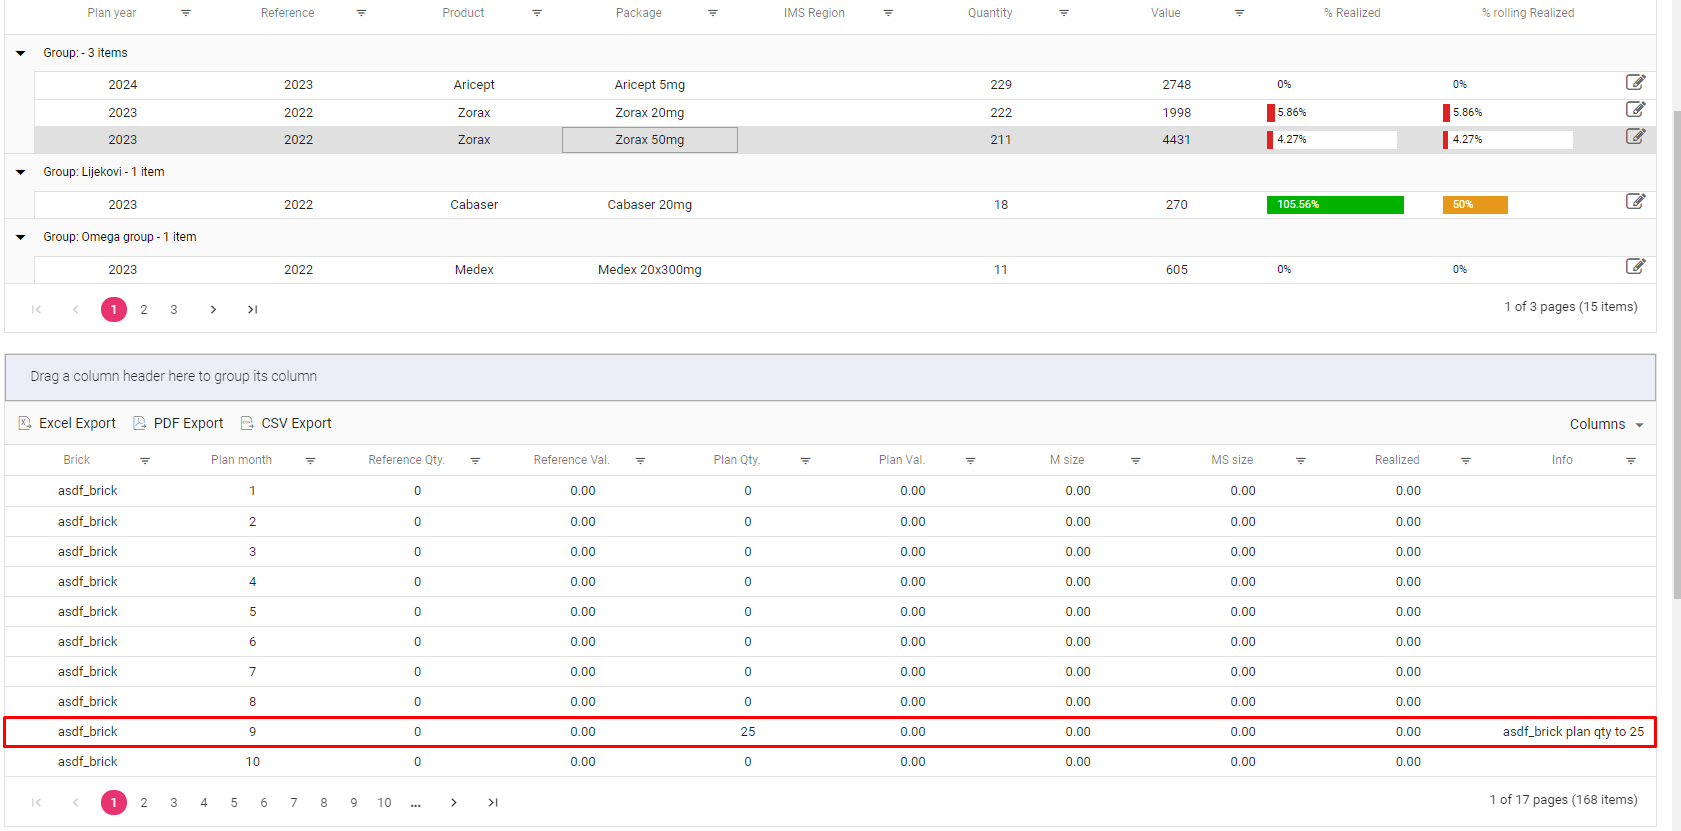
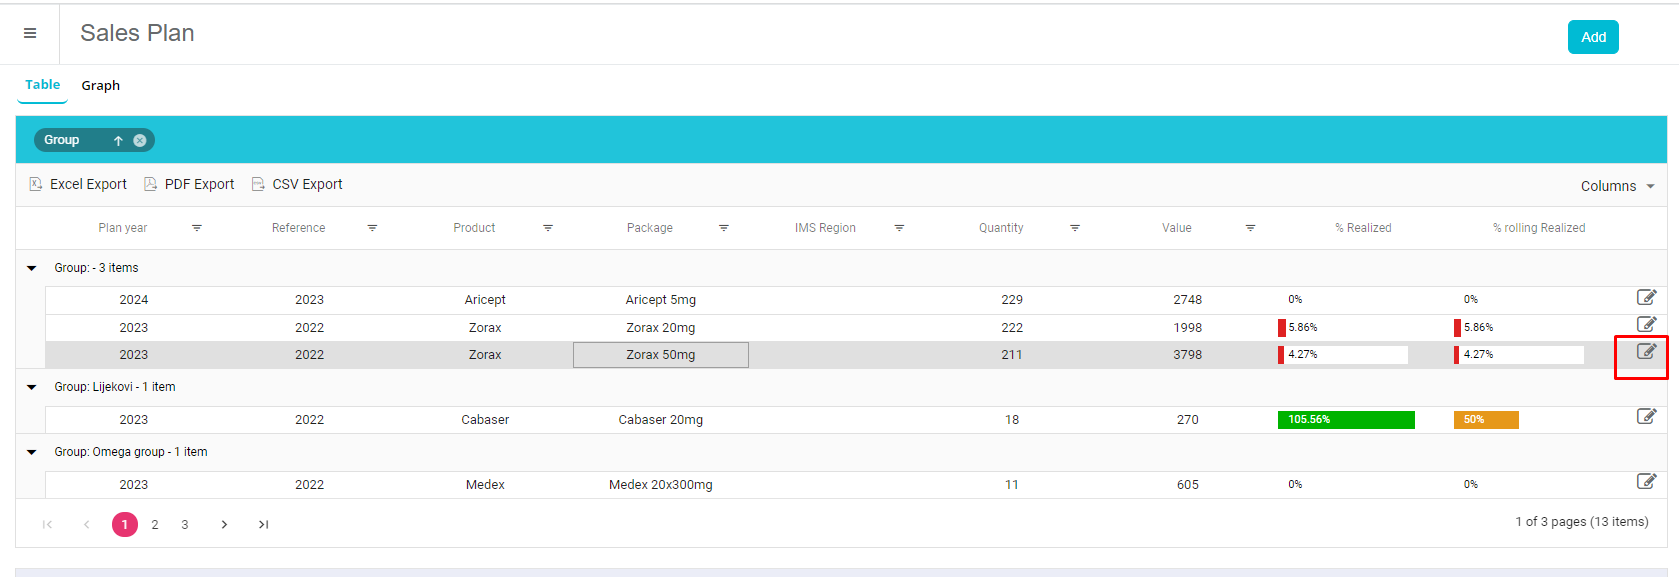
Preview of saved sales plans with the possibility to display them grouped according to different criteria, export them to Excel, PDF or CSV, and to filter the list
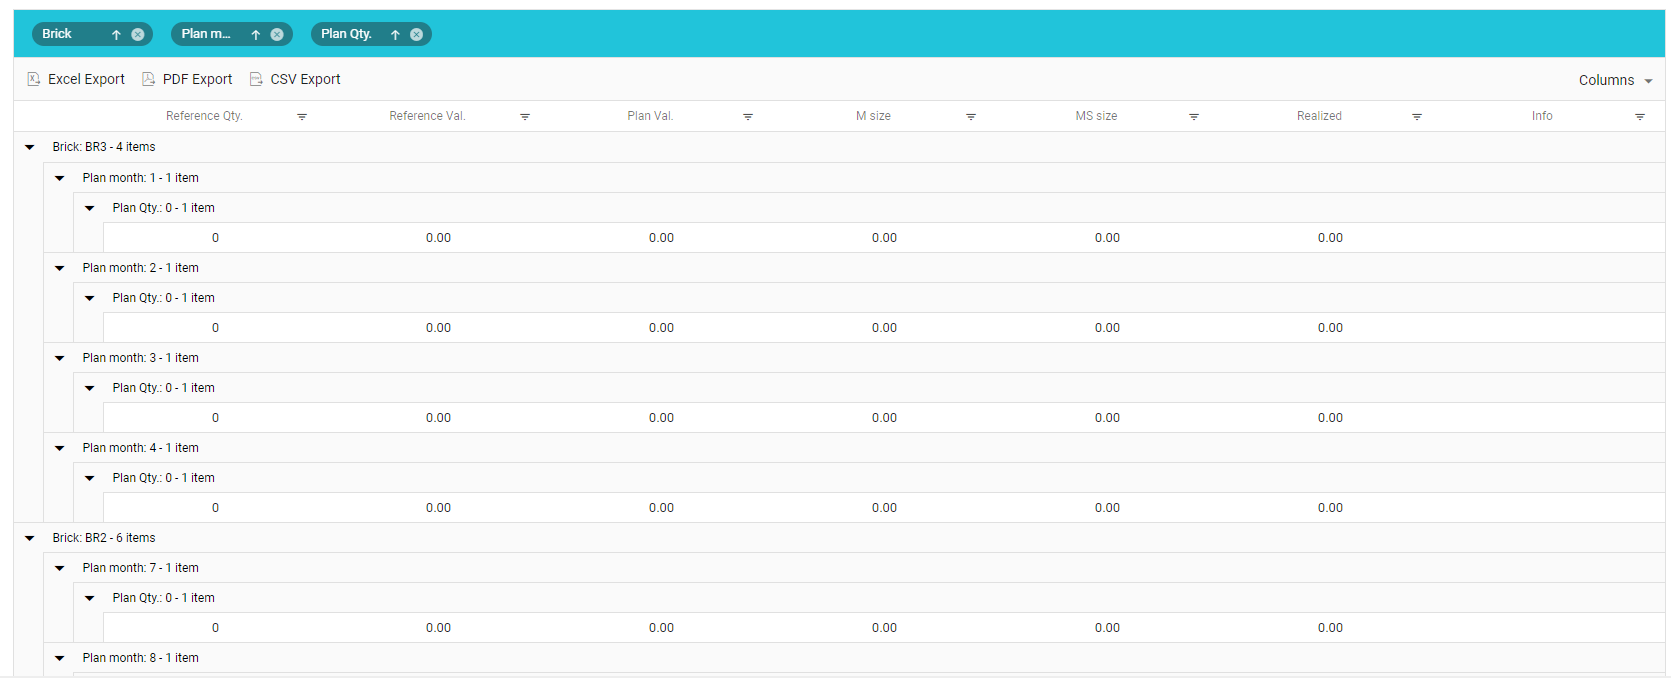
In the lower part of the screen, for the selected sales plan, division by bricks and months with the possibility to display them grouped according to different criteria, export them to Excel, PDF or CSV, and to filter the list
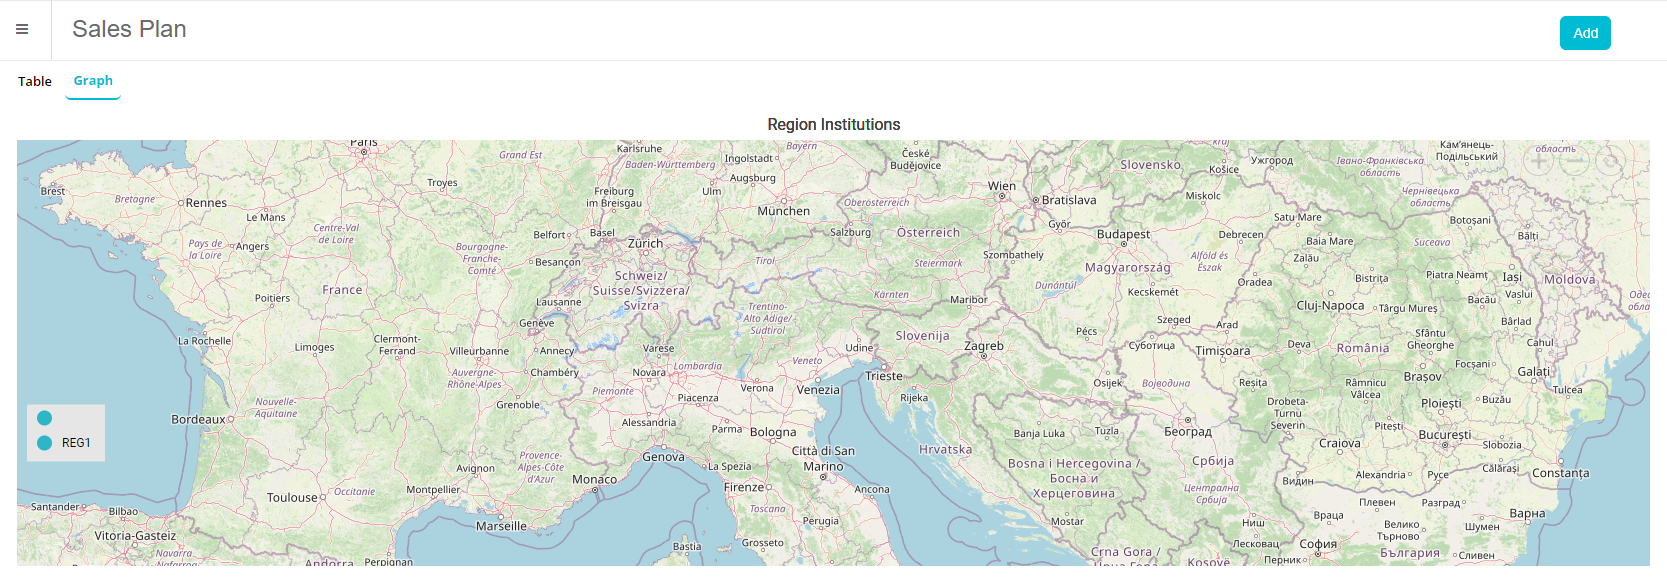
On tab Graph we show location of a region, to be more precise, value of sales plan.
Adding a new definition of sales plan
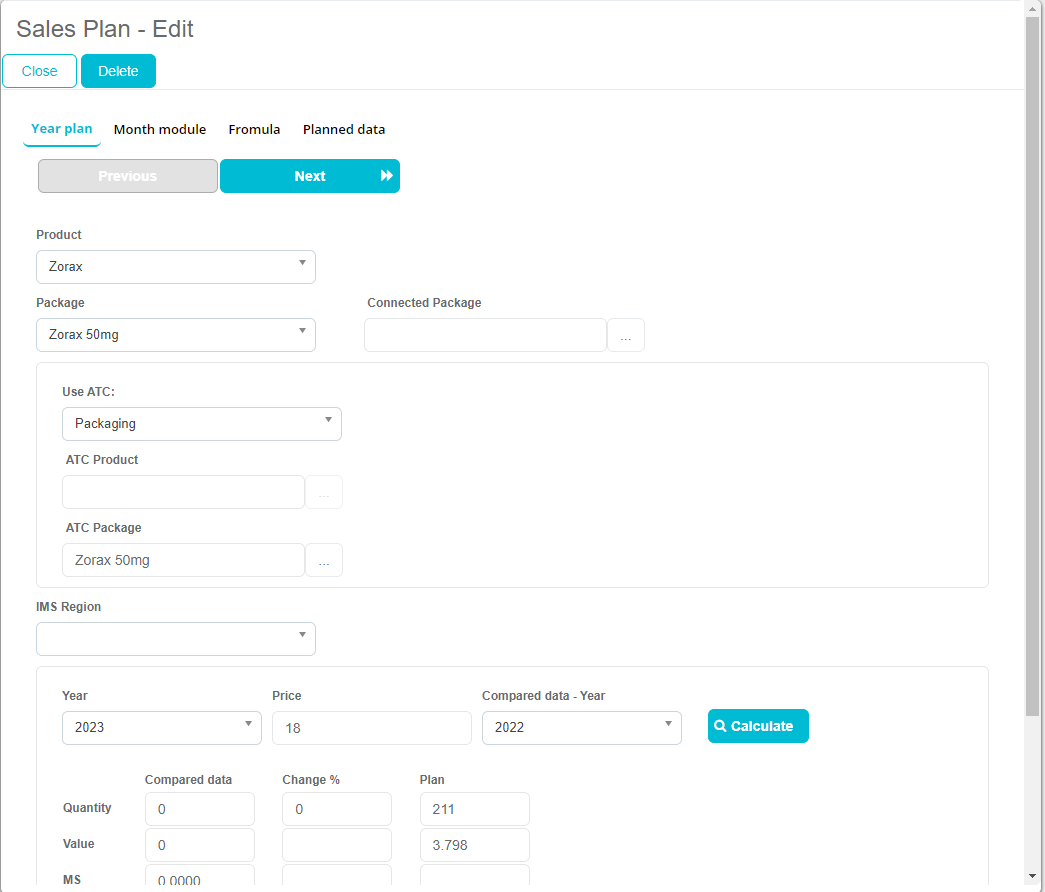
To add a new sales plan, click on an “Add” button in the top right corner. You will be presented with the following screen:
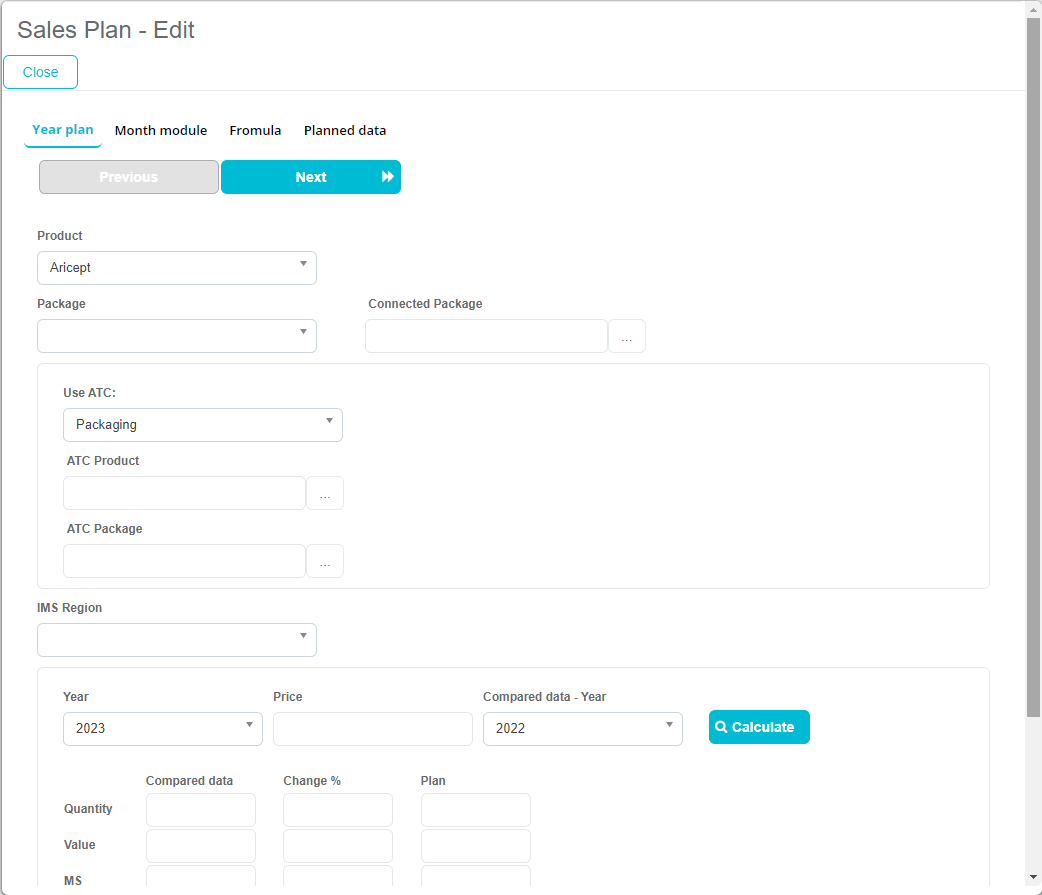
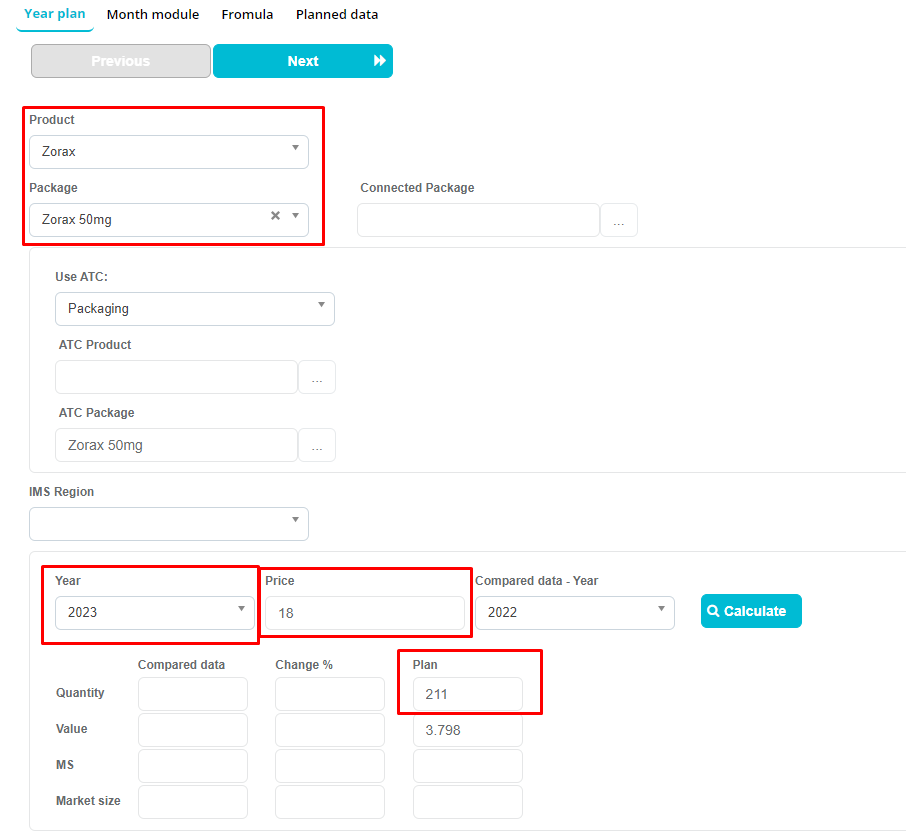
In here you have to select Product, Package, Year of the sales plan, and planned quantity. If you were to click on “Calculate”, system would automatically calculate the planned quantity, value, MS, market size.
After inputting the required data, press on “Next”.
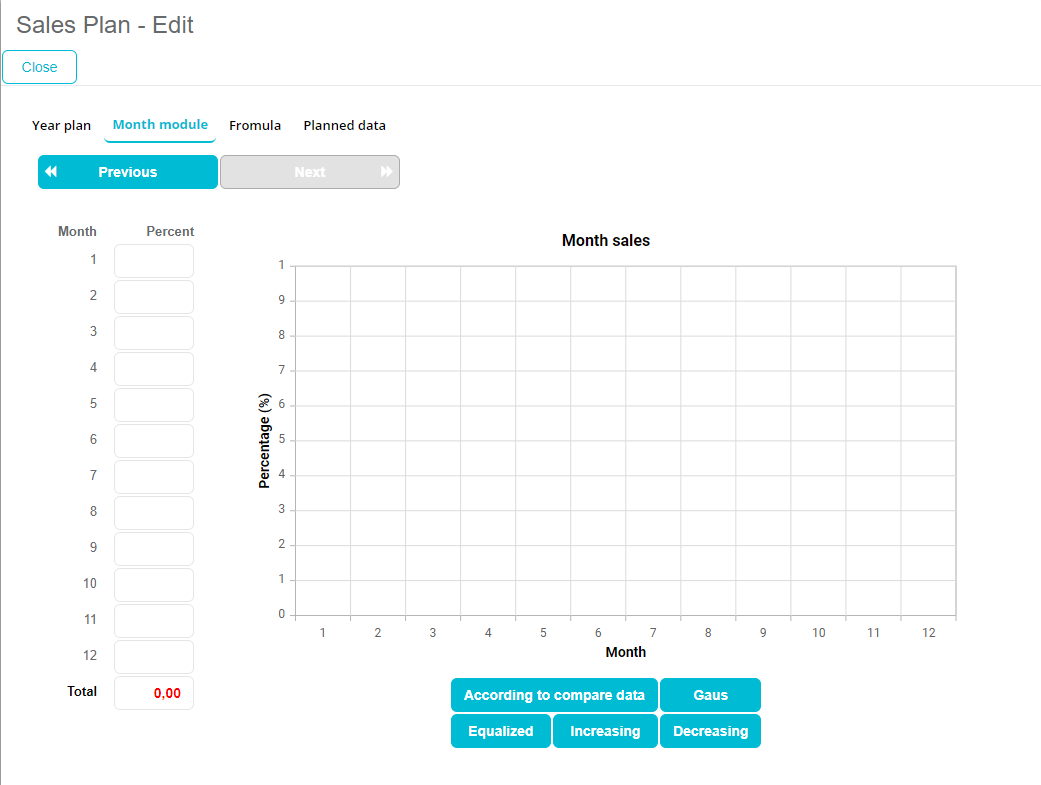
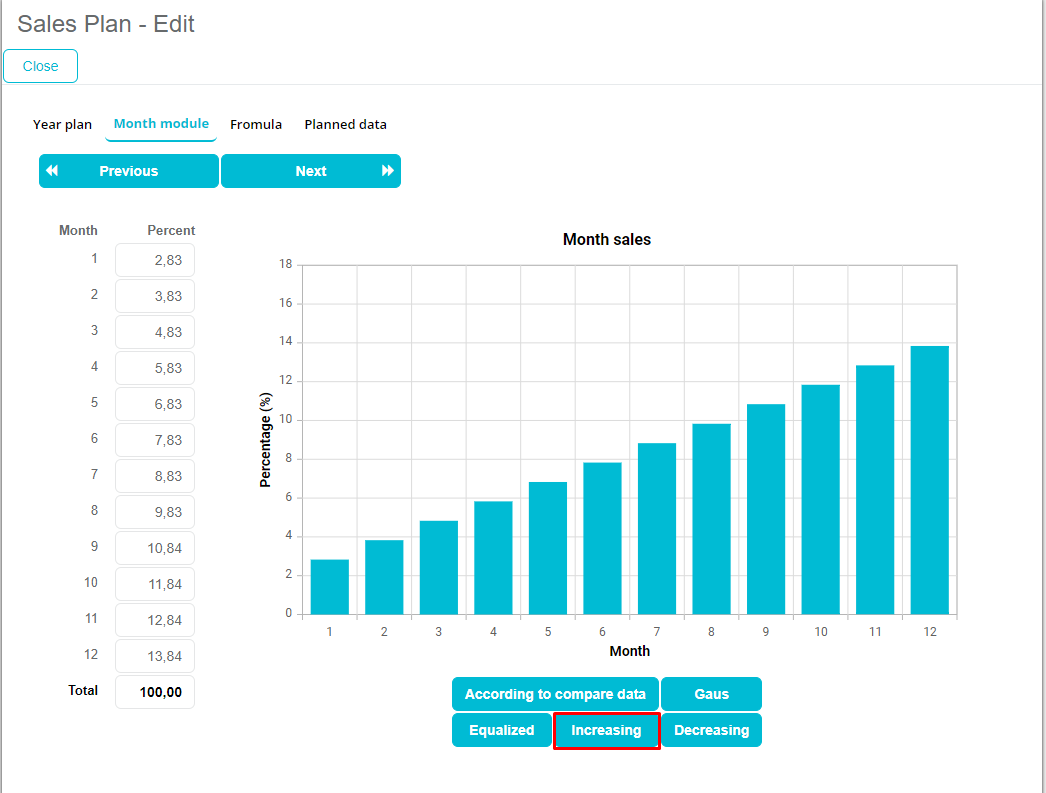
Next step is defining % of sales per months. There are some predefined buttons that will input the percentages or us, such as “According to compare data”, “Gaus”, “Equliazed”, “Increasing” and “Decreasing”, or we can input the values ourselves.
For our example, we have selected “Increasing”, and after doing so, we have to click “Next”.
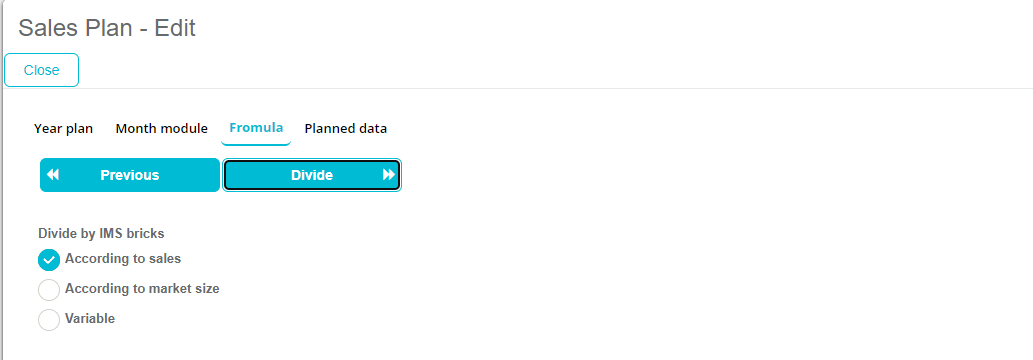
The next step that we have to take is select the formula. We have 3 choices: “According to sales”, “According to market size” and “Variable”. After selecting the formula, click on “Divide”.
After clicking on “Divide”, system will let us know in the bottom right corner that it has saved our sales plan.
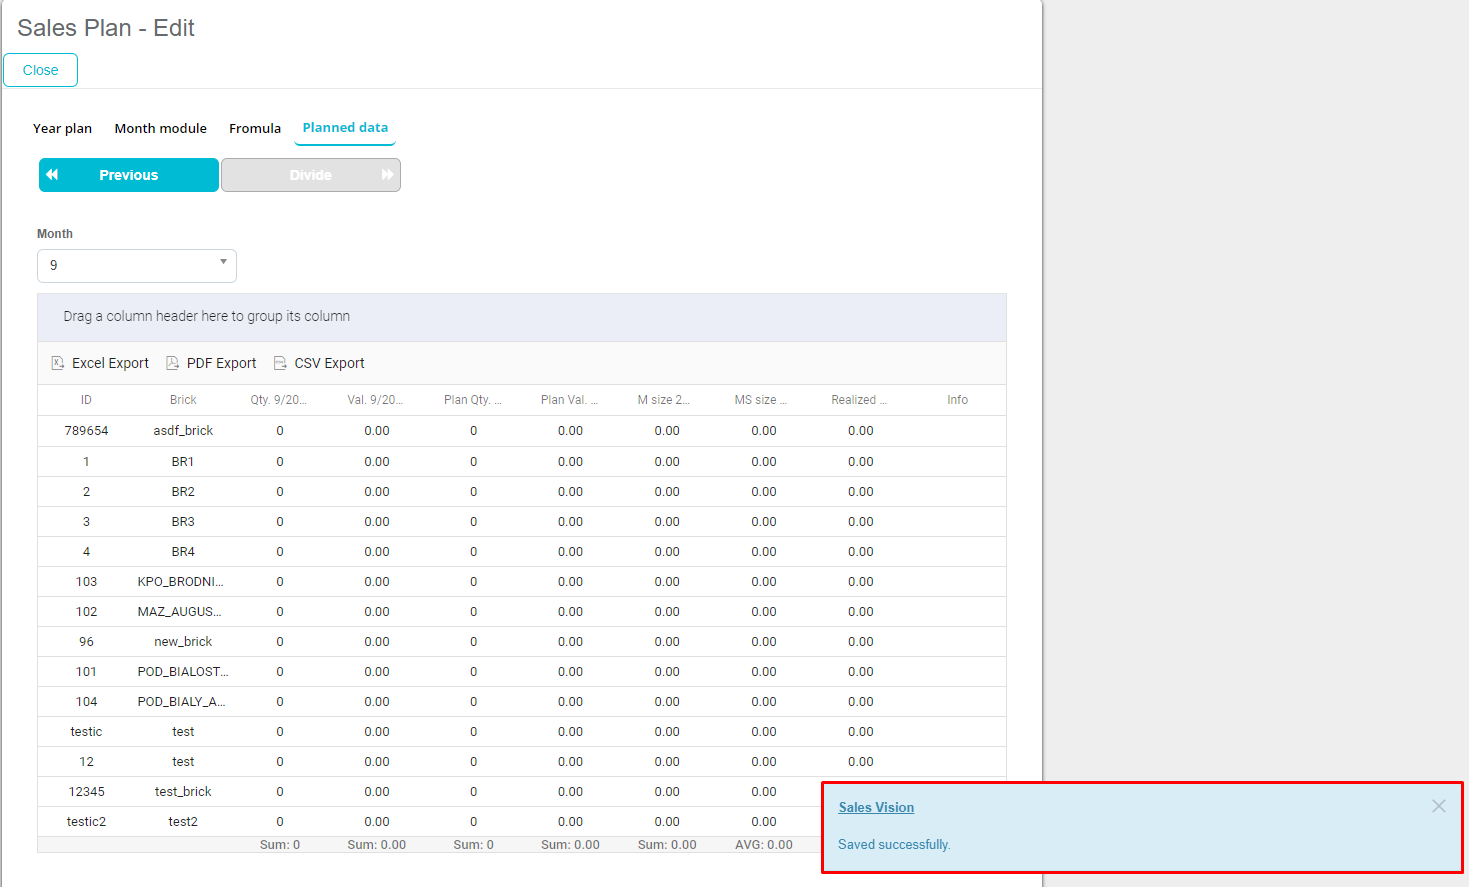
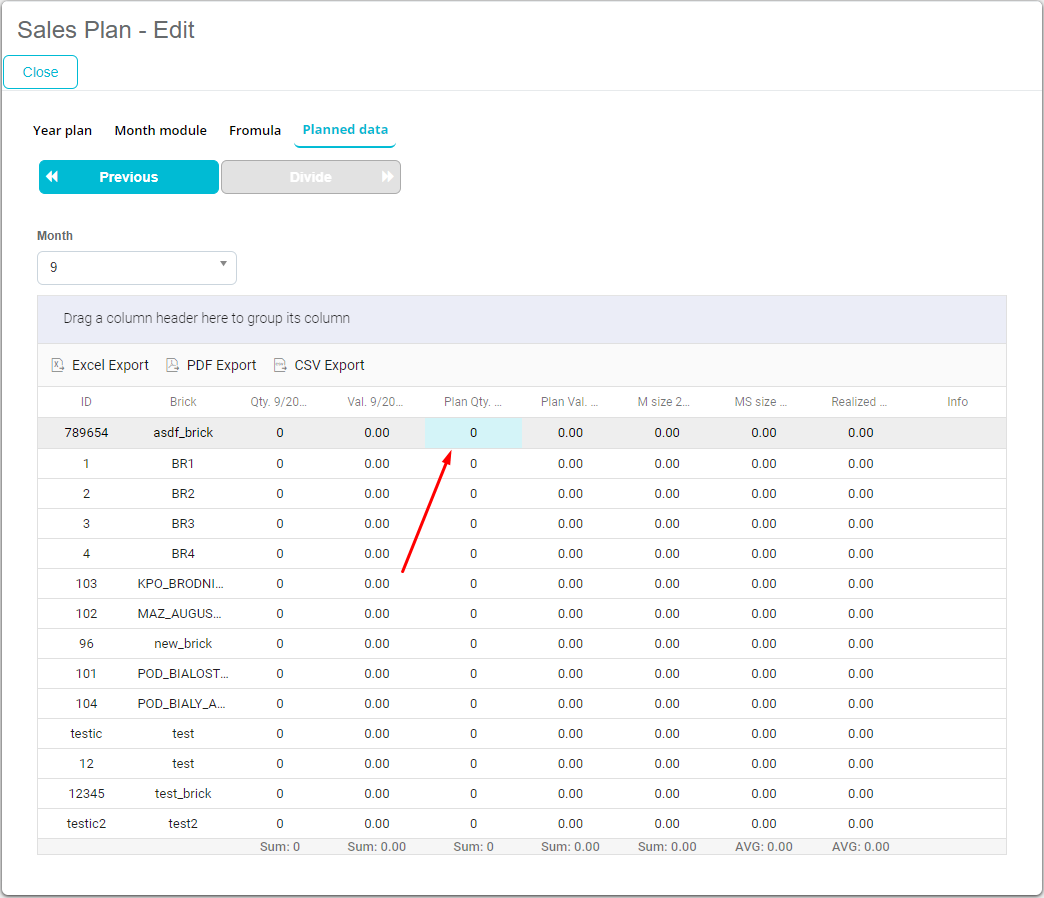
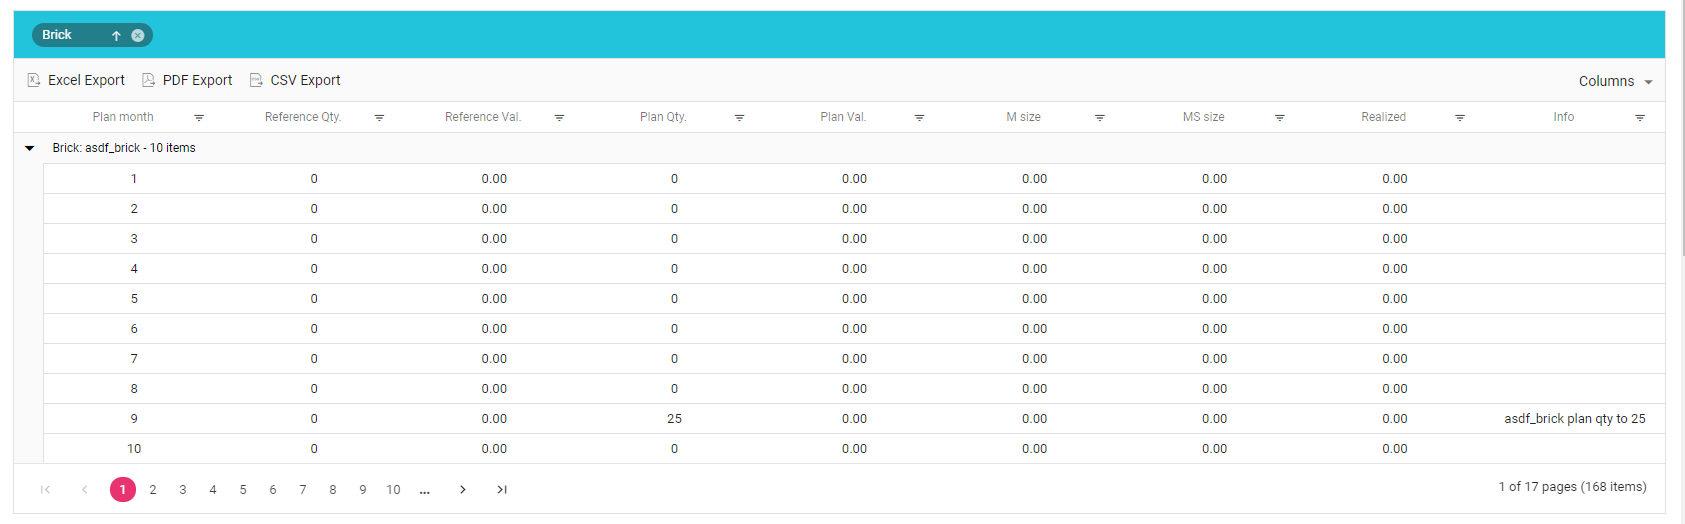
On Planned data tab, we can edit plan qty. for each brick, editable columns change color and mouse cursor is different.
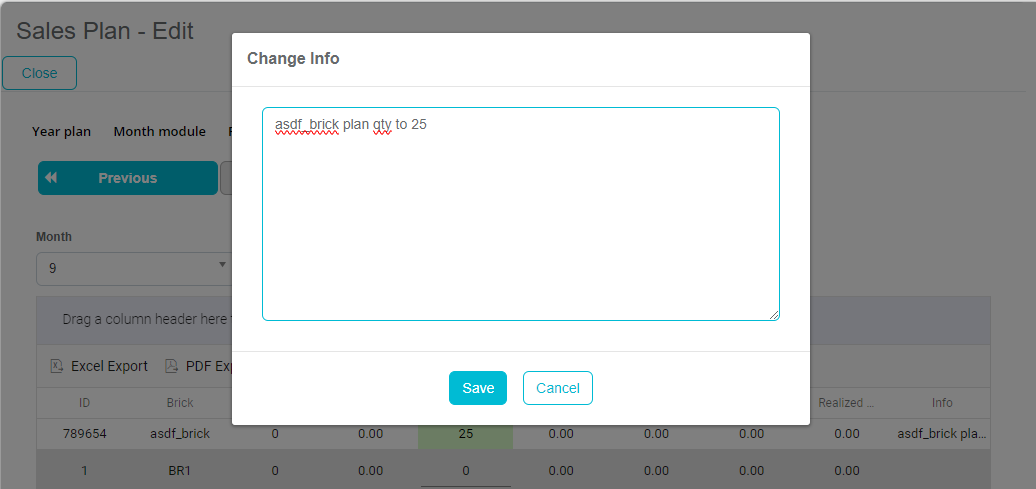
After editing plan qty., we are presented with the change info window where we can insert info text.
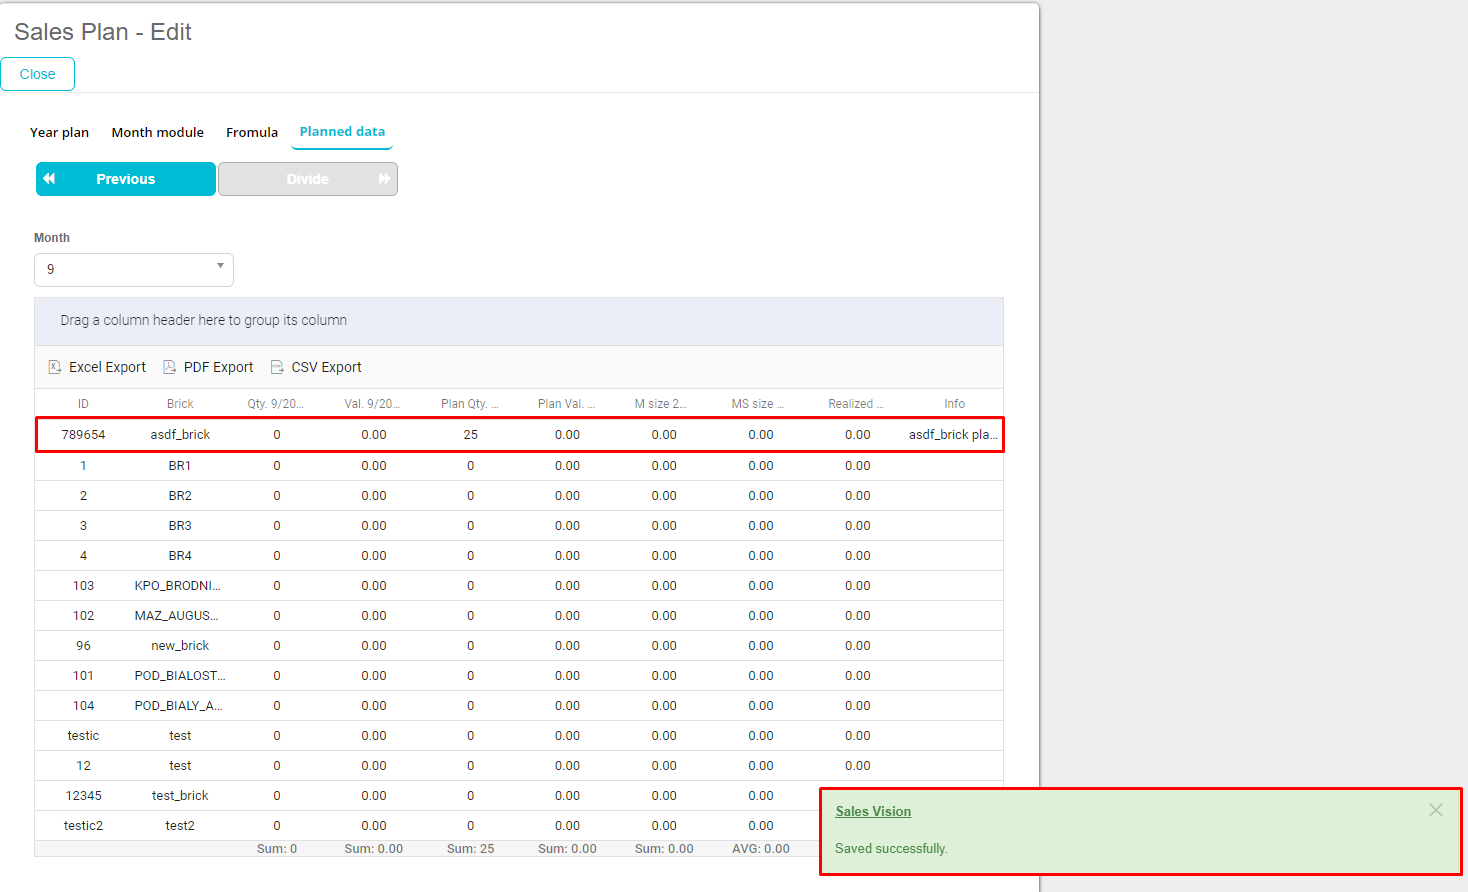
Now we can click on “Close” to go back to the Sales Plan module.
Editing a sales plan
To edit an existing sales plan, we can click on the edit icon in the far right corner of selected sales plan.
When we enter a sales plan, we can also see “Delete” button.
If we want to edit any of the data for current sales plan, we can click on the desired field and edit it, and to save the changes, we have to click “Next” until “Planned data” tab where system will tell us that changes were saved successfully.
Grouping data
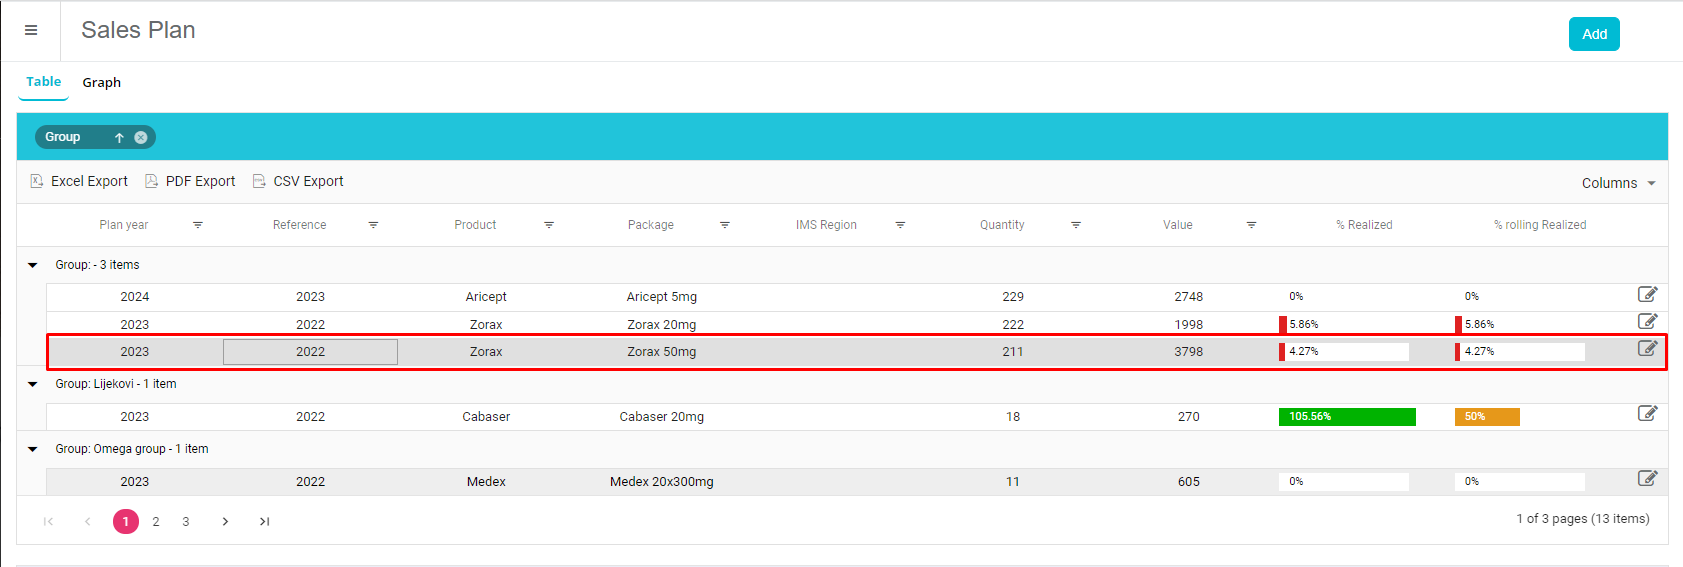
We can group our data by column by dragging a column header to the marked space.
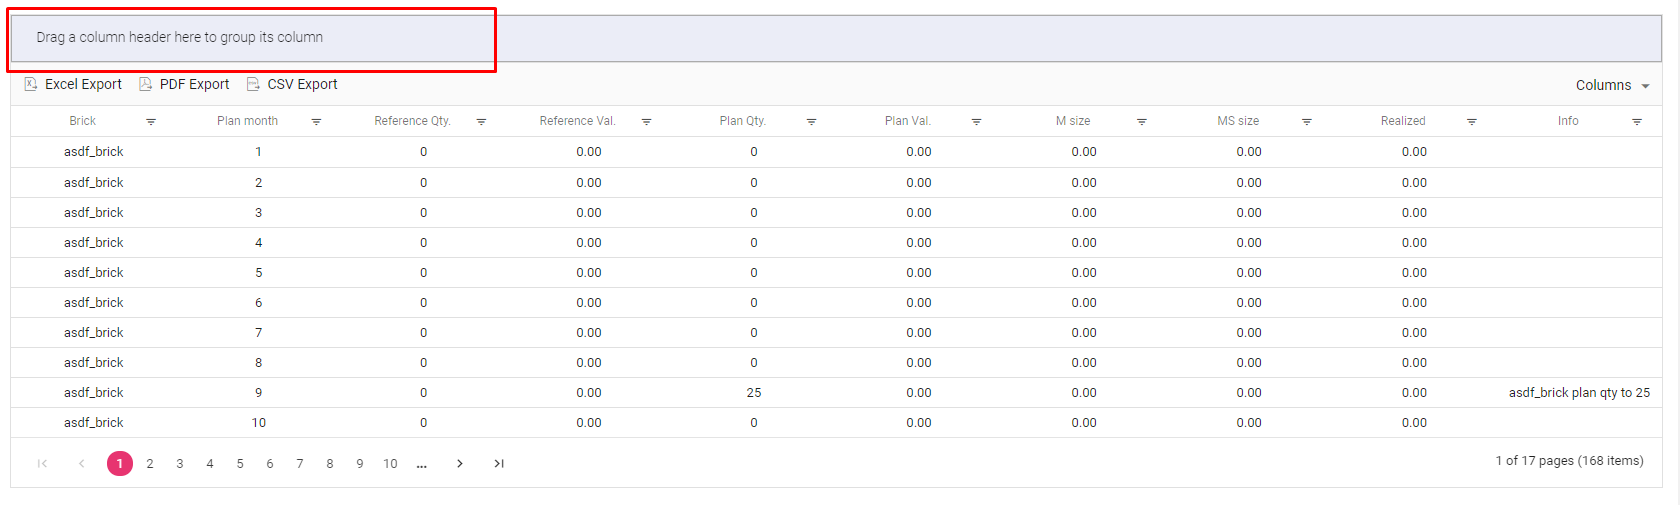
For example, we have decided to drag column header “Brick” and now data is immediately grouped by bricks.
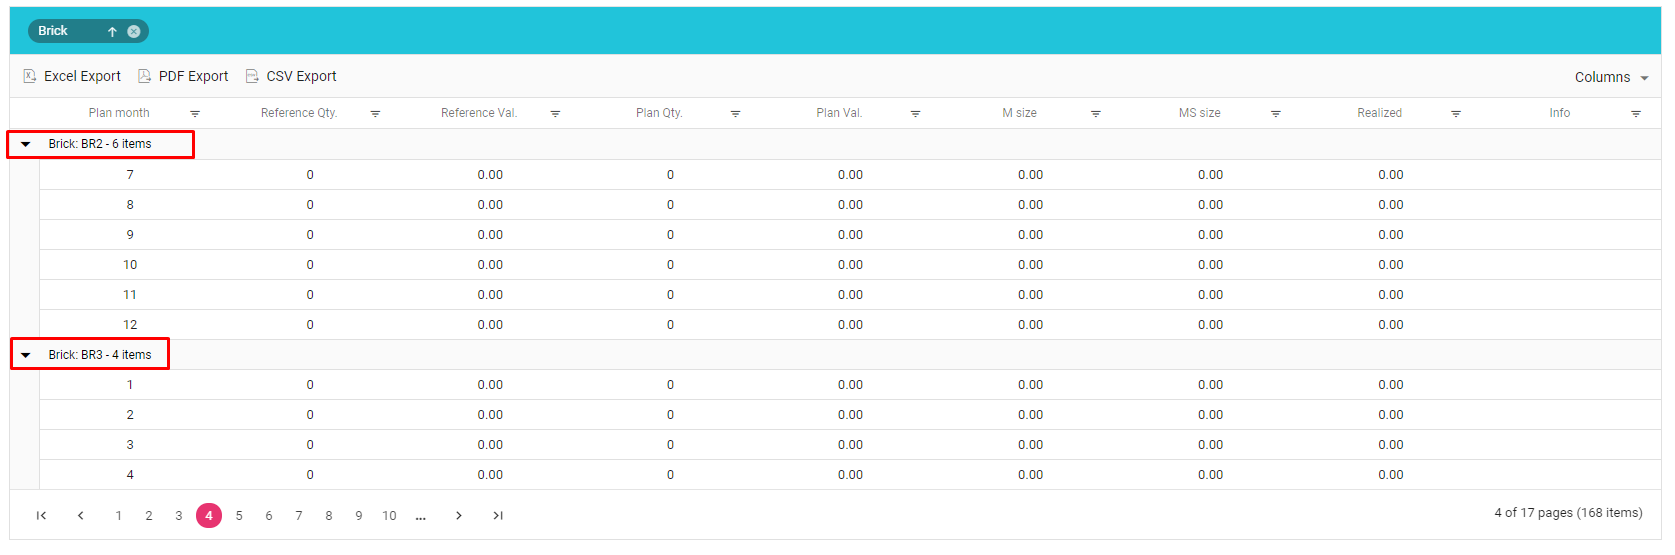
It’s also possible to group by multiple column headers.